Evolution of the price of the
natural gas for 30 years
Thomas Chaize
February 5th, 2005
The natural gas is often forgotten by
the investors for the benefit of the oil this is due to its moderate cost.
But since the beginning of year 2000, the natural gas went out of its hibernation
at the same time as the other sources of energy, they were forgotten too by
the investors. This article is a simple graphic analysis of the price of the
natural gas in the USA since 1976 with some remarks on the market of the natural
gas.

I. The graph of
the price of the long-term natural gas.
A. 1979-2000.
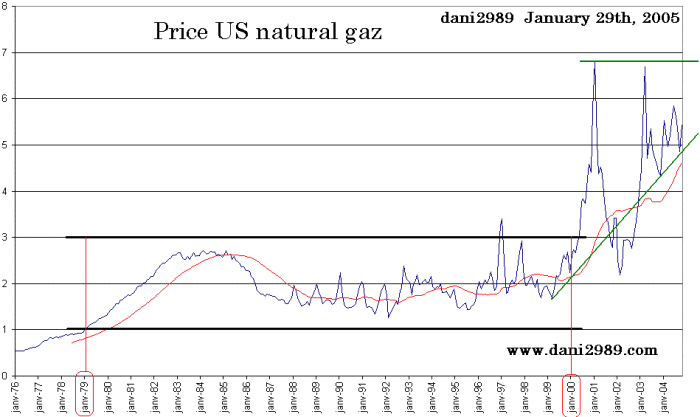
From January 1979 till January 2000, the price of the natural gas stayed between
1 dollars and 3 dollars. The average of the price of the natural gas, during
these last 20 years, is 1.95 dollar by thousand cubic feet. The average price
is thus in the middle of the canal.
B. Taken out of the canal in January,
2000
At the beginning of year 2000, the price of the natural gas goes out by the
height of canal, it breaks then the resistance of 3 dollars by mcf. Then,
the price of the natural gas got twice a maximum slightly below 7 dollars
by mcf.
C. Construction of a triangle.
The triangle of the price of the natural gas forms itself from January, 2000.
The triangle builds itself from 2 dollars and ends in 7 dollars by mcf. In
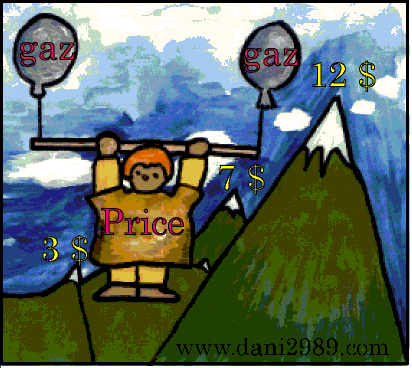
case of exit by the height, the objective is 12 dollars (7-5 = $5, $5+7=12).
Even if this triangle is invalidated, and that the price of the natural gas
goes out on the bottom of the triangle, there is a very big support which
should prevent it from falling below 3 dollars by mcf.
D. Perspective of the price of the natural
gas.
- Pessimistic option: we have an exit on the bottom of the triangle, there
is then an evolution of the price between 3 dollars and 7 dollars by mcf,
with an average price of the natural gas in 5-dollars surrounding by mcf.
- Optimistic option: the exit of the triangle is made by the height and the
price of natural gas evolves between 7 dollars and 12 dollars by mcf with
an average price in the zone 9 dollars in 10 dollars by mcf.
But, it seems to me totally excluded
that the price of the natural gas comes down again durably below 3 dollars
by mcf.

II. Some remarks on
the market of the natural gas.
A. The reserves known for natural gas
of Canada fell in spite of record investments in 2003. Canada is the third
producer and the second world exporter, the production of natural gas of Canada
represents 7.3 % of the world production. It is the first exporter of natural
gas towards the USA. The companies drill more and more wells for fewer and
fewer discoveries.
B. The price of the natural gas releases
itself more and more with the liberation of the market of the gas in numerous
countries. It is traditionally a long-term market, but bit by bit a free market
of the gas appears ( to resume of course), what engenders big short-term price
changes (I still resume). The companies of gases get free more and more long-term
sales what returns the price of the much more volatile natural gas.
C. The investments for the transport
of the natural gas are very important. Pipelines are often needed to transport
the natural gas of the place of production in the station of liquefaction.
The gas is then liquefied in a temperature of 82 ° with a pressure of
47 bars. It is transported in a gas carrier until a unity of Gasification.
It is for that reason that the transport of the gas is 6 - 10 more expensively
than that of the petroleum.
It is just three remarks and not an analysis on the market of the natural
gas, that deserves some dozens pages of explanations.
The subject is the evolution of the
price of the natural gas, but it is the price of the energy in general that
knows a sharp increase. You should not especially fall in the trap of the
short-term cyclical justifications (weather report, political crisis, …etc.).
The reasons of the increase are structural long-term modifications (constant
increase of the demand, the decline of the discoveries, and the increase of
the costs of the new discoveries,…. etc.).
The cheap natural gas, it is ended! As it is the case for the oil, the coal
or the uranium. The evolution of all these sources of energy in the same time
indicates the beginning of a bullish movement to very long term. The natural
gas goes to see its price to increase in a important long-term way. The natural
gas will never fall durably below 3 dollars by mcf. This article is very incomplete,
I shall return as soon as possible on this subject to make technical analyses
supplementary and add explanations on the situation of the natural gas generally.
Be careful!! This is only a personal opinion, build your own opinion with
your searches.
Thomas Chaize
Mailing
list
dani2989@voila.fr
