|
TUESDAY EDITION June 9th, 2026 |
|
Home :: Archives :: Contact |
|
|
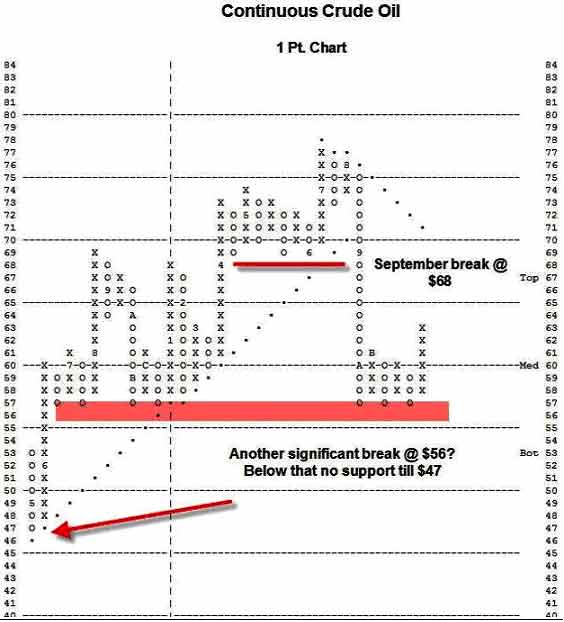
Outlook 2007: Commoditiesby Bruce Zaro In part 2 of this 3-part series on market technicals, Bruce Zaro takes a look forward at the technical condition of a number of commodities, a group that has become so popular in recent years. NYMEX Crude The line in the sand is drawn at 56, as in $56 per barrel of oil. If crude breaks below that mark, we could see $47 to $52, yet a longer-term chart suggests this area in the mid-$50’s should act as formidable support which won’t fall easily. Because buyers of crude have come in to buy in that range on 7 separate occasions over the last year-plus, however, a breach of $56 would strongly suggest a test of the 50 level or even slightly lower:
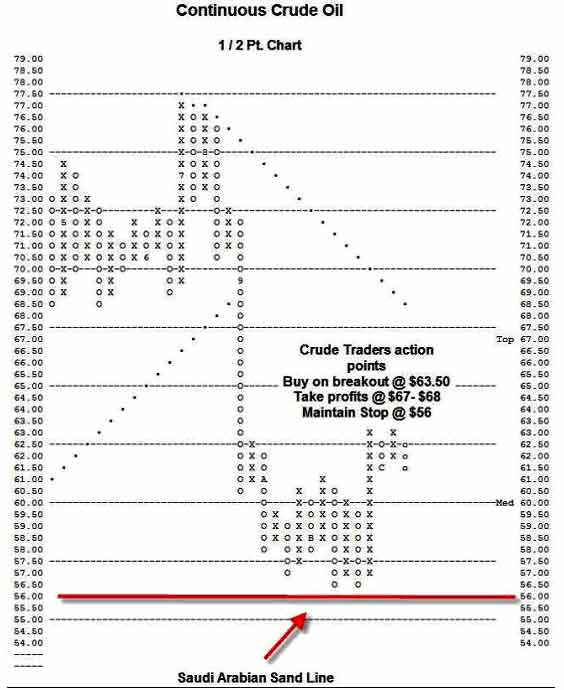
A faster-acting chart of ˝ point-per-box provides a way to look at crude’s action in a different light. Here, however, the case remains the same; it is trading very close to the Saudi Arabian line in the sand at $56, the October lows which still seem to define the line of support:
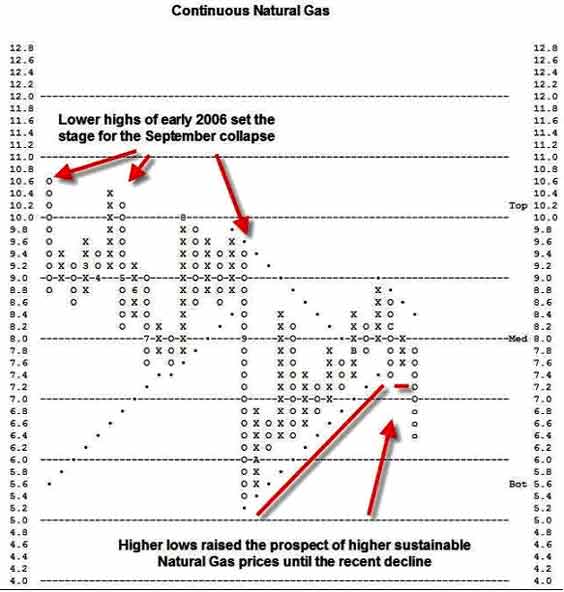
Since crude’s 4th quarter bounce to the $63 range, that point now offers the next bullish action point; for crude to become a buy, it would have to breakout at $63.50. The problem is, meaningful chart resistance as well as the Point and Figure Bearish Resistance Line loom near $67 - $68, which means that crude has a lot of technical work to do before it would suggest that a lot of upside potential exists. And in the meantime, the going could first get even tougher for crude traders. **Note from DGA: Since the writing of this article at year-end, crude’s downward action has added more O’s to the declining columns in both charts above, bringing it closer to that support “line in the sand.” The comments above still apply, however. Natural Gas Continuous Supply and mild weather concerns caused NG investors to withstand extreme volatility in 2006. Whether an asset is headed higher or lower, the trend line is the most basic compass of that asset’s trend. For gas, the positive trend line had been in place since October of 2000 but was broken in September of ’06:
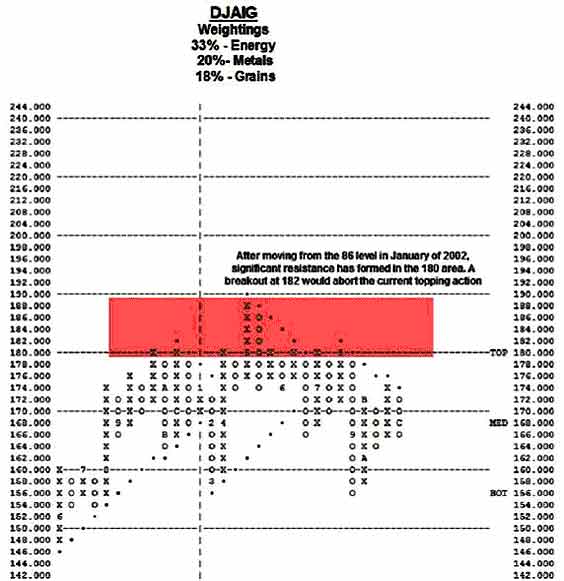
Commodity investments are generally volatile, but natural gs was an extreme case in the number of times the trend line changed last year. Currently, the trend is clearly negative; in fact, a move back down to the $5.20 low of September now seems likely. Dow Jones AIG Commodity Index) 2006 was not as simple a year for commodity investors overall as recent ones had been, as the Dow Jones AIG Commodity Index, helped along by the 2nd half fall in crude, logged its first losing year since 2001. After the 87% rally seen since early 2002, this index was due for a consolidation period, at the very least. While this index’s 33% weighting in crude makes the DJAIG sensitive to oil’s volatility, even strength within other raw materials has not provided enough positive action to prevent this chart from looking very toppy:
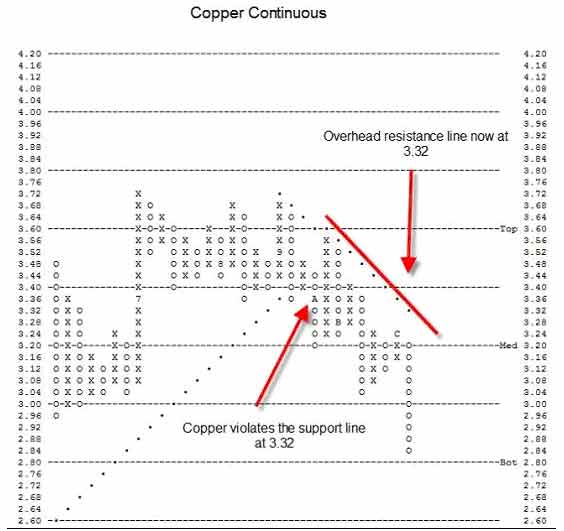
…instead, we are heading into 2007 while the chart of this commodity index shows significant overhead resistance in the 180’s. A move to break out above 182 would abort the current topping pattern, while a breach of the low 150 support would suggest much lower targets that most commodity bulls would today consider unimaginable. Copper I last commented on copper in September (Commodities: A Technical Update – 9/26/2006). In that article I suggested that although copper had held up well considering it had broken its uptrend line at 3.36 (intact since 2001), the chart at that time showed little reason to own or bottom fish for copper at that time. Since then, bounces have indeed been generally uninspiring:
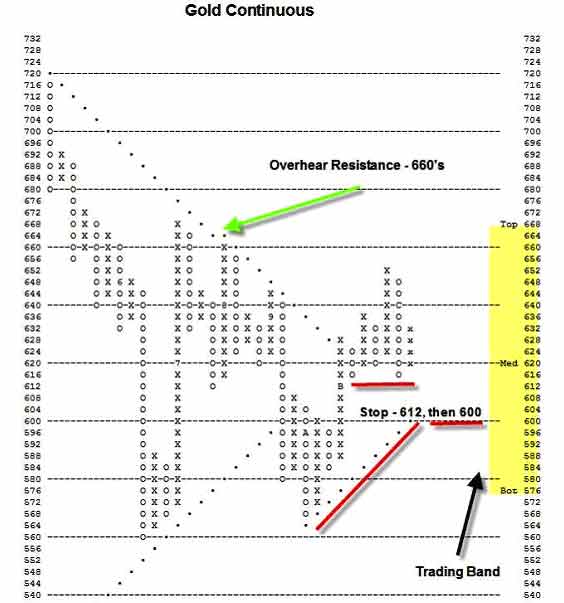
Although copper today is below the bottom of its suggested trading band at 2.80, any trades today would be for aggressive investors only. Trend lines are especially important to protecting or accumulating wealth, thus when holdings move through these lines I take them seriously. While many times a broken-down asset does experience a bounce, it is then often just a dead cat bounce that really does not diminish the fact that trend has changed. Any bounces in copper from here are likely to be the same—short-term and dangerous in nature. Most investors would be wise to show patience and let this chart develop over time until the trend can change back to positive. As things stand now, such a change for the better would occur at 3.32. Gold Gold is in the rebuilding stage as it has rebounded sharply from its sharp mid-year correction. Gold’s chart looks similar to that of oil, which sold off in the late spring, followed by a vigorous rebound in July that lead to a re-test of the year’s low in October. Gold, however, has done a bit better, holding above its early summer low this time while showing subsequent strength with numerous buy signals as it has worked its way up towards the top of its trading band and near recent resistance in the 660’s:
So far, gold remains an orderly uptrend which supports the view that gold can work its way still higher. I typically look for backing and filling for evidence of a chart working off its overbought conditions. In Late November gold became 77% overbought on its expected trading band. While this condition was not as extended as the April / May reading—gold was 193% overbought on its weekly trading band at that time—the late November condition has been rectified and gold resides almost exactly in the middle of the band now, pretty good technical action considering how other commodities are faring. In addition, it remains just above its 50, 150 and 200 moving averages. Further, gold did show a recent positive divergence compared to the major US market indices and it remains a superior relative strength performer against these benchmarks. Traders can initiate positions here with a tight stop at the triple bottom break at 612, while longer-term investors can use $600 as their stop. Current Bullish price objectives point once again up toward the 660’s. Remember, though, gold remains a commodity, which means it too can be subject to extreme volatility. I favor a trading-oriented strategy at this time to lessen the chances of getting should gold’s technical condition deteriorate. In summary: with gold as a possible exception, there looks to be a lot of dangerous, toppy-looking action in commodities at present. Even if the long-term case for commodities remains intact, we all know that meaningful corrections and trying times can occur along the way. Broadly speaking, commodities look more at risk of facing such a challenging time period than they have in many years. **Speaking of the long-term case for commodities, many investors favor oil and have looked to Canada’s energy trusts for such exposure. However, the Canadian government’s recent proposal to dramatically alter the royalty trust landscape continues to weigh on the minds of investors. To learn more, get “Ottawa Bombshell!” our exclusive, free report on this important situation by visiting: http://www.deltaga.com/reportForm.asp?rep=4 January 07, 2007 Over his 20-year investment career, Mr. Zaro has become a highly-regarded technical analyst who runs private client portfolios at Delta Global. He recently served as the Managing Director of Granite Wealth Management outside of Boston and spent nearly 15 years prior as a Vice President at Gage Wiley & Co. His current firm is full-service, but specializes in providing international market access as well as alternative investment strategies. In addition to U.S. market coverage, Mr. Zaro applies his expertise in technical analysis to stocks and stock markets around the globe. |
| Home :: Archives :: Contact |
TUESDAY EDITION June 9th, 2026 © 2026 321energy.com |
|