|
TUESDAY EDITION June 9th, 2026 |
|
Home :: Archives :: Contact |
|
|
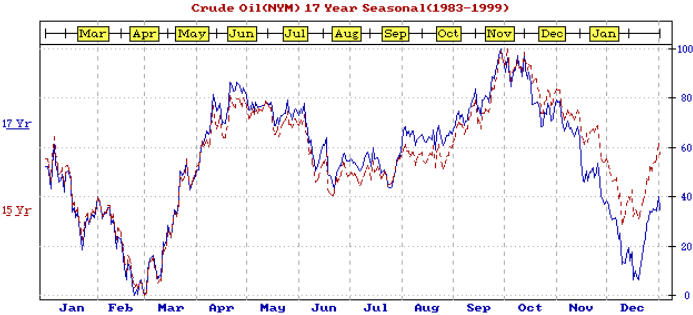
Gold/Oil/Copper -Is it that time of the year yet?John Winston info@technicalcommoditytrader.com www.technicalcommoditytrader.com August 21st, 2009 Crude Oil How about Crude oil? Things have been very choppy lately. Are we peaking? Interestingly, if we look at the seasonal chart, we can see that crude oil usually has a very choppy August, with up and down and sideways action. The good news for the bulls is that the Crude oil market still has about another 6-8 weeks left of its seasonal action.
(NOTE – Do not follow the yellow months. Those are Futures Contracts. Follow the blue months at bottom of chart.
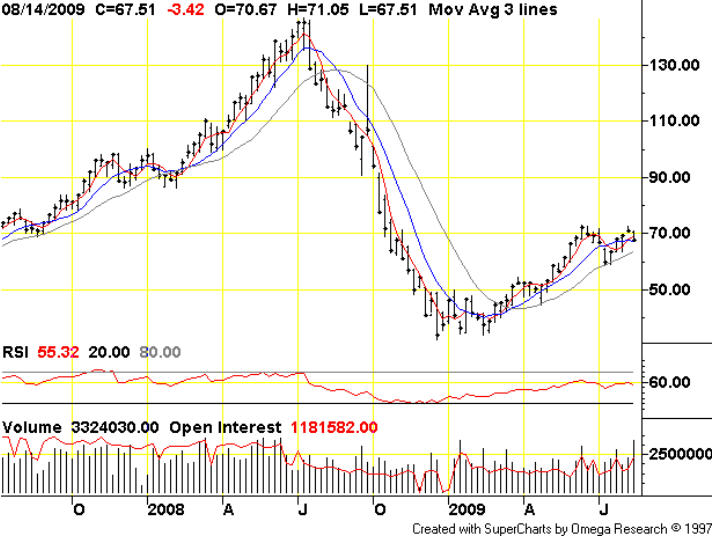
In the crude oil chart below, we see the same meltdown of 2008 as we did in Copper. But other than that, the chart is following seasonality “this year”. But let’s look at what happens when “seasonality” inverts. You can see we bottomed in February of 2008 in February and we rallied to April. So far so good. But instead of pulling back into July and making a low, look how we exploded up and made a high in July. In fact, crude oil was the “MEDIA BOY” at the very peak. That its final ascent was a seasonal inversion will be something to keep an eye out for when we watch other inversions in the future. But that was it. When everyone got back home from July 4th vacation it was the end for crude as it virtually collapsed.
By time crude stopped plunging it was December. A look at the seasonal chart shows that the lows for crude are the December and the February area time period. Look how crude made a December low and moved sideways right to the last week of February and made its lows at the 33 area. Thus this year’s oil bottom was right on time as far as the seasonal goes. The pullback from April to May developed, but May was very strong and seasonally, it’s usually a sideways market. This is a sign of strength. And how about the July low in crude? On the chart the pullback did not begin until June (very late) and it lasted only 4 weeks. This was another sign of strength. And so now here we are in the middle of August and prices are knocking on the door of above 70 for the second time. Will Crude peak out here? While it is getting late in the game, the seasonal suggests not yet. On average, the peak is not due until the October time frame. But we want to be on guard when price slows.
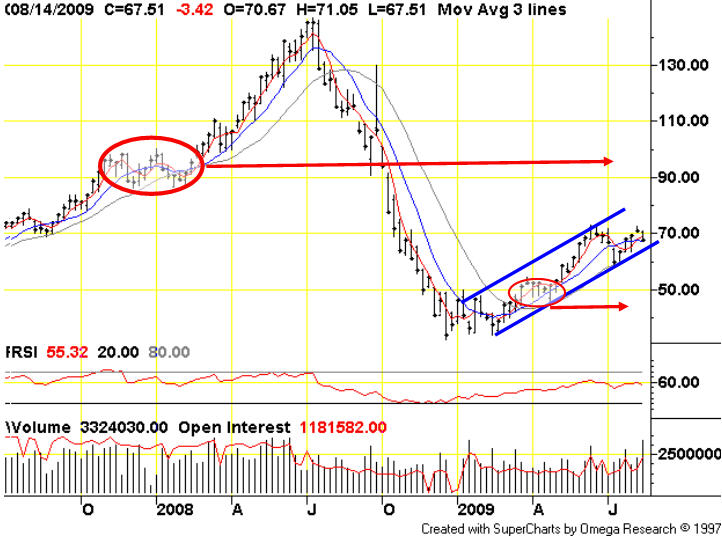
The crude chart above suggests that RESISTANCE is the 90-100 dollar area. I’ve highlighted the area from late 2007 where that resistance or pressure point area exists with a red circle and have drawn an arrow towards that resistance point that is coming up. Should the rally continue odds favor a peak near or at that area and then a pullback into February? At this time we are in an uptrend channel as price is within the blue channel lines. As long as price remains above the trend line or the lows established in July, the trend is intact and odds will suggest higher prices. As we near the end of the seasonal, we always have to be on guard for weakness. For instance, notice how we recently made a double top in price just above 70. If we look to the very far left of the chart we can see that in August of 2007 price just happened to be where we are today…………..at the 70 area. Notice how that year had a small pullback in September before the rally into late October/early November. That pullback support was the 70 area, and as you can see we are encountering resistance at this price point also. But in 2007, it was just a pause, and small pullback before the next leg of the rally. When price finally did peak at October’s end, notice that the correction that began was sideways at best…….indicative of strength. Sure enough, prices started a rally right around the end of February where the seasonal suggests bottoms are usually made. So what do we make of this rally? It is maintaining its uptrend momentum and velocity when it is inside the blue channel range. I’ve noticed over the past four weeks that we have been hanging around the bottom end of that channel and it would be nice (if you’re a bull) to see a thrust above 75. That would increase the odds that the September portion of the seasonal would be under way. Keep your eyes on the US Dollar also. Moves above the 80-82 area could put a lid on crude prices. For now (barring a dollar rally), odds suggest that the rally is not complete. We have support at the 57-60 area should the blue channel line not hold price. Either one of these areas should provide support. Lastly, I’ve drawn another circle under the 50 dollar area. This area has a good chance of providing support for next year’s pullback near winters end. Closing thoughts While oil has led the charge since the lows in commodities, the seasonal price averages of these commodities suggest that first copper and then oil should hand the baton over to the gold market at some point in time this fall and take a break while gold leads the pack up. Since we live in strange times, one needs to be aware that a US Dollar rally could squelch these commodities should it embark on a rally. Interestingly enough, the dollar index is at a key spot on its chart. Should the dollar move above the 80 area, and then the 82 area, oil, gold and copper will have a lot of potential price pressure put upon it. If you do venture into this area, keep one eye out for the US dollar and moves above the 80 area on the index. John Winston info@technicalcommoditytrader.com www.technicalcommoditytrader.com August 21st, 2009
|
| Home :: Archives :: Contact |
TUESDAY EDITION June 9th, 2026 © 2026 321energy.com |
|