|
TUESDAY EDITION June 9th, 2026 |
|
Home :: Archives :: Contact |
|
|
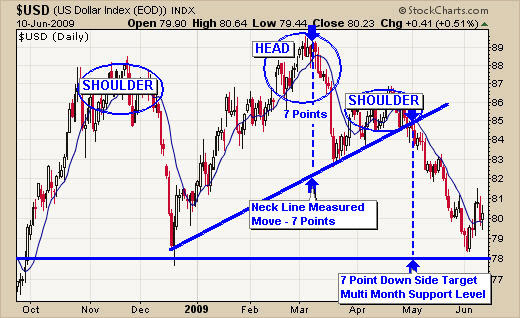
The Oil & Nat Gas ReportChris Vermeulen With so much happening in the market, emotions flying high and from being blinded by fear and greed many investors are wondering What do I do now? I have put together some of my trading charts to help keep the overall picture clear for us commodity traders. My approach is very simple and effective when proper trading/money management is applied. FEAR and GREED are the two most powerful forces in trading and if you cannot stomach your trades when they go south, you most likely are trading to large of a position for your account size. Ok, I will try to stay on topic and not get into the education side of things J The US dollar has had a massive rally considering the United States is in serious trouble. My thoughts are investors bought the USD as the entire planet started to crack thinking it was a smart investment. Which is could be a great play for the long term but I plan on covering that next week with monthly chart analysis for all these commodities. I have heard a few analysts on CNBC say the US Dollar has broken its down trend. The question I am wondering is: What time frame are they looking at? The daily chart looks strong but if you zoom out and look at the weekly or monthly chart, we have not even made a higher high yet. Everyone sees the market differently that’s for sure. The US Dollar – Head & Shoulders, Knees then Toes This chart shows a perfect head and shoulders pattern which made a text book breakout. To keep this report short and to the point, the USD is at support and I expect we will see a rally higher to the 84 – 88 levels which would complete a larger head and shoulders pattern on the monthly chart. A breakdown from the monthly head and shoulders would most likely start the next major leg lower. The USD could rise here, thus pull the price of gold and silver down temporarily and that is why I have locked in some profits on these commodities.
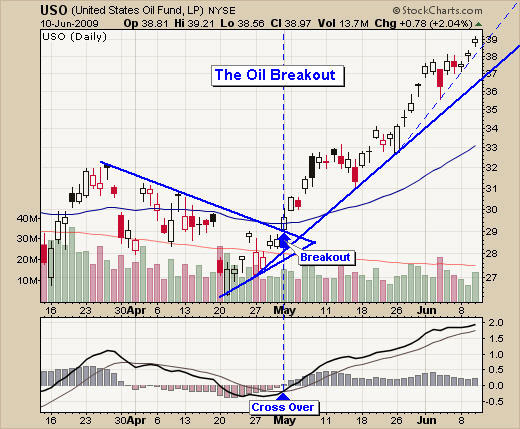
The Price of Oil – Daily USO Fund Oil has been on the run since May. Oil had a near perfect breakout/buy signal (Risk was over my 3% risk setup) but many traders took advantage of this signal and are now experiencing massive gains. Tighten stops to lock in some profits and let the rest ride until the next support trend line is breached which will provide more wiggle room for oil to take a breather before moving higher again.
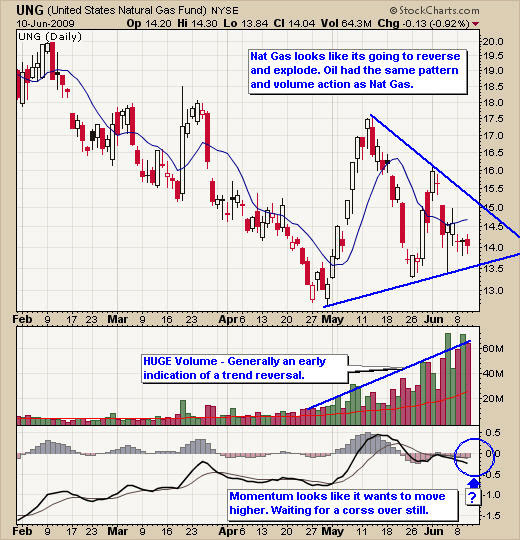
The Price of Natural Gas – Daily UNG Fund Last week I provided the weekly charts with analysis of all these funds. UNG was the one that really looked exciting. On the weekly charts its very similar if not identical looking to the price action that oil had before it sky rocketing. This chart looks like a spring coiling tightly and getting ready to explode. Only time will tell but keep it on your trading platform!
Trading Conclusion for Gold, Silver, Oil & Nat Gas In short, the US Dollar is trading at support and could be starting a nice rally to form the second shoulder which can be seen on the monthly chart. If this happens I expect gold and silver will have some selling pressure. Oil continues to rally and short term traders should be thinking about tightening their stops to lock in some gains on the first sign of a reversal. Natural Gas looks locked and loaded for a big bang. I’m waiting for my signature setup before jumping onboard as it helps improve the odds of the trade going in my direction after I enter a position. If you would like receive my Free Weekly Trading Reports or my Real-Time Trading Signals for these funds please visit my website for more information: www.GoldAndOilGuy.com Chris Vermeulen This article is intended solely for information purposes. The opinions are those of the author only. Please conduct further research and consult your financial advisor before making any investment/trading decision. No responsibility can be accepted for losses that may result as a consequence of trading on the basis of this analysis. --------------- |
| Home :: Archives :: Contact |
TUESDAY EDITION June 9th, 2026 © 2026 321energy.com |
|