|
TUESDAY EDITION June 30th, 2026 |
|
Home :: Archives :: Contact |
|
|
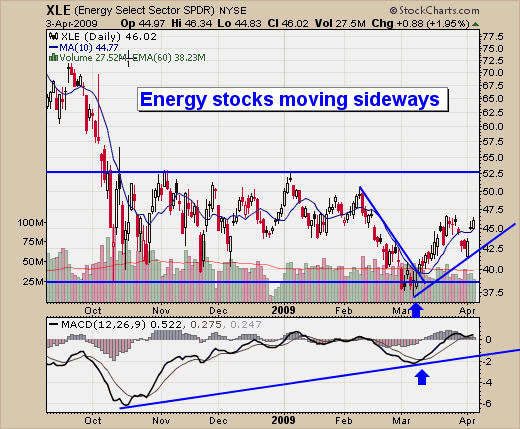
The Energy Sector and the Most Powerful IndicatorChris Vermeulen The energy sector has been moving sideways since October if, you look at the XLE energy ETF below. Although the energy sector dipped lower in March the bullish percent index is showing some signs of strength. A lot of stocks continued to drift lower in March due to the lack of buyers and not because of heavy selling. This pulled the sector lower until buyers stepped in and pushed things higher again. Energy Stocks ETF – Daily Chart Sideways price action since October with momentum pushing higher.
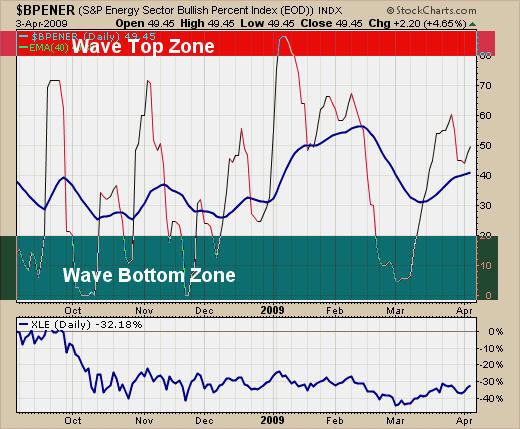
Energy Bullish Percent Index – Daily Chart The bullish percent index is starting to show signs of a reversal with some follow through. This index made a new multi month high and has started to move north again. This week will be interesting to watch. Hopefully we start to see more stocks have point and figure buy signals, which is what this chart is based on. The bullish percent index calculates the percentages of stocks in a sector, which are on a Point & Figure Chart buy signal. It is used to determine overbought/oversold conditions. The index/sector fund cannot be applied directly to individual stocks but rather to the entire sector. The bullish percent indicator is one very powerful tool for swing trading intermediate trends. It works well with every sector, especially the energy and gold sector. The key here is to trade with the trend and enter on pullbacks with low risk buy signals. Trade the opposite in bear markets. I used this for a gold buy signal in December and prices had a 16% rally. These are the exact types of trades I wait for in energy and gold. I like to catch a few of these each year, which makes up the majority of my gains. I use several other charts to confirm buy and sell signals along with my strict money management rules for not making trades if risk is over 3% and never riding a losing trade down. Sometimes, depending on the market condition, I will scale in and out of positions using this chart. Accumulate on Wave Bottom Zone and scale out, when the sectors is at the Wave Top Zone. This strategy can carry a big draw down, so using other charts as well can minimize risk.
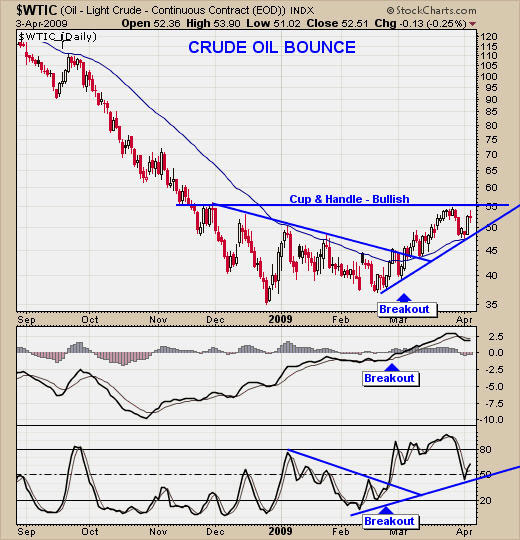
Crude Oil Breakout – Daily Chart Crude oil has been holding strong since is breakout at the beginning of March. Last week we had a pull back, which was expected at that level. A cup & handle patter looks to have formed with the current price forming the handle. This is a bullish pattern and a breakout to the upside should send breakout traders buying oil.
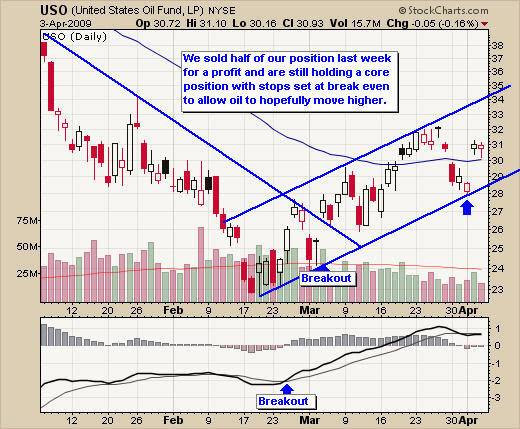
Current USO Trade – Daily Chart Currently we are long USO from the beginning of March and some profits locked in and the balance of our position set with a stop at break even. This fund had a breakout with MACD confirming along with physical crude oil prices. The bullish percent chart also was deep in the Wave Bottom Zone, which indicated a short-term oversold level.
The Energy Sector Conclusion: The Energy sector currently looks bullish, while gold is looking bearish at current levels. This week will be interesting to see how it unfolds. We are currently long oil and I do not see any buy signals for other areas like natural gas, which should provide some explosive profits once we have a confirmed buy signal Chris Vermeulen This article is intended solely for information purposes. The opinions are those of the author only. Please conduct further research and consult your financial advisor before making any investment/trading decision. No responsibility can be accepted for losses that may result as a consequence of trading on the basis of this analysis. --------------- |
| Home :: Archives :: Contact |
TUESDAY EDITION June 30th, 2026 © 2026 321energy.com |
|