|
WEDNESDAY EDITION June 24th, 2026 |
|
Home :: Archives :: Contact |
|
|
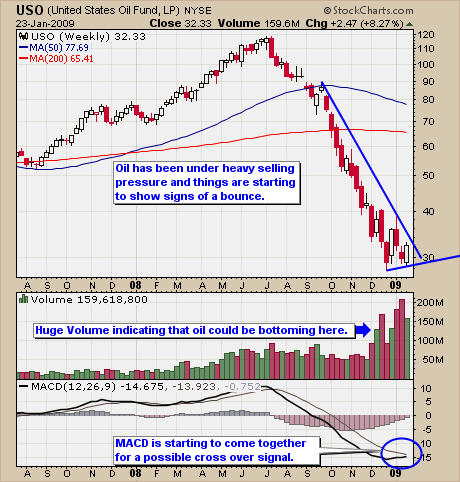
Crude Oil Trading Analysis/SignalsChris Vermeulen Crude Oil is something that I think has huge potential because of its prolonged down trend without any real bounces and also because there is so much interest from traders and investors around the world who want to catch its bounce. The weekly chart is starting to look amazing and the daily chart looks ready to pop. Crude Oil Weekly Trading Signal ľ Explained The weekly oil trading chart shows a long 7 month sell off without any bounces on the way down and volume has increased as the price continues is slide lower indicating that there is more and more interest from traders and investors. Prices have now put in a small bounce and will be testing our downward trend line if the price of oil continues to rally this week. Also the MACD (momentum) is about to cross to the upside which is very bullish. If oil prices breakout above our down trend line and the MACD crosses over to the upside then we will have a buy signal in oil on the weekly chart. Weekly Crude Oil Trading Chart with Possible Oil Buy Signal
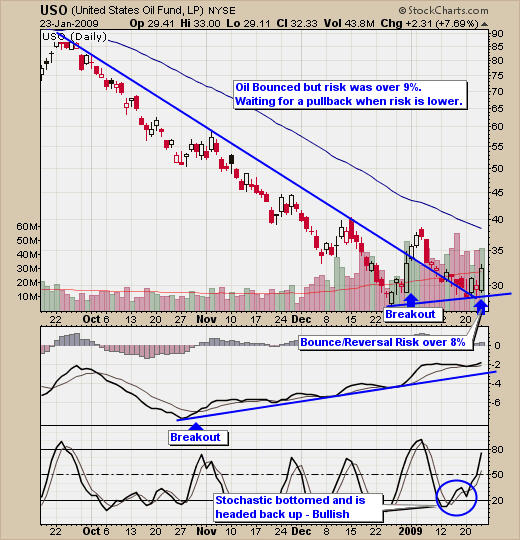
Crude Oil Daily Trading Chart ľ Explained Crude Oilĺs daily chart is very bullish looking as well. The price has broken is downward trend line and has pulled back to a support level over the past 2 weeks. Fridays big bounce gave us a buy signal for USO because everything for my oil trading strategy was in favor (MACD cross, Stochastic, Trend line Break, volume). The only issue was that risk was over 3%, currently at 9% I will wait for a better entry point on a correction which will also confirm the new trend. Crude Oil Daily Trading Chart with Oil Buy Signal
Crude Oil Trading Conclusion: Crude oil as you can see looks to be a picture perfect setup as momentum in the price is slowly shifting direction. While many traders went long on Fridays buy signal I am waiting for risk to decrease before I put my money to work. I donĺt mind buying things at a higher price if the overall risk is lower and the reversal looks strong. Chris Vermeulen This article is intended solely for information purposes. The opinions are those of the author only. Please conduct further research and consult your financial advisor before making any investment/trading decision. No responsibility can be accepted for losses that may result as a consequence of trading on the basis of this analysis. --------------- |
| Home :: Archives :: Contact |
WEDNESDAY EDITION June 24th, 2026 © 2026 321energy.com |
|