|
TUESDAY EDITION June 9th, 2026 |
|
Home :: Archives :: Contact |
|
|
Uranium UpdateApril 20, 2008Trendsman http://trendsman.com/ trendsmanresearch@gmail.com Two months ago I penned an editorial calling bottom on the uranium stocks. Technically I saw many stocks deeply oversold yet positive momentum was starting to build. A few months later and the positive momentum divergences have continued to build. A few U stocks did indeed bottom but more have made slight new lows. While we need price to confirm a bottom it is important to note that forming significant bottoms can be a timely process. Last update I looked at the relative weakness of uranium against both commodities as a sector and energy prices as a sector. Using Uranium Participation Corp (U.to) as my proxy for uranium prices (because it tracks the U price well) it was obvious how oversold the sector had become. In the last two months the sector has become even more oversold as natural gas and oil have continued to rise. I don't think that should deter investors. Despite being in a bull market, energy commodities haven't been immune to sharp corrections. The following chart shows U.to, Oil and Natural Gas. 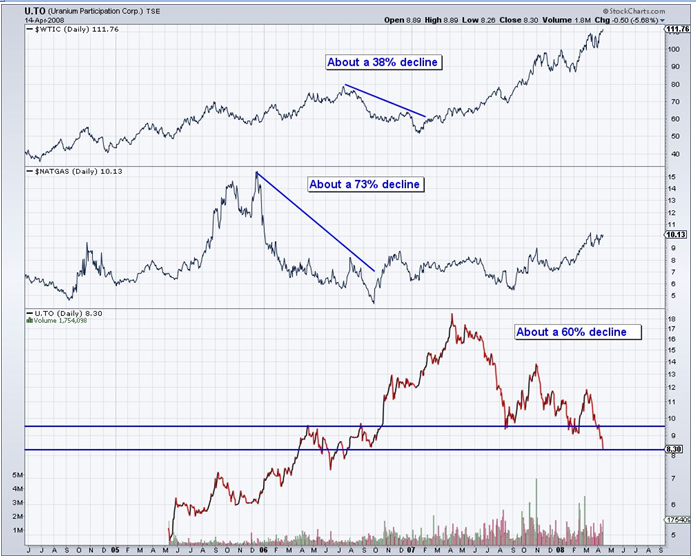 Natural gas endured a 73% decline but is on its way towards a retest of $15. Oil declined 38% and was able to make a new high just 15 months later. Oil also declined 54% in 2000 and 2001. U.to has fallen about 60% while the spot uranium price has declined roughly 50%. Normal is not the best word to describe the uranium correction but investors should take heart that both oil and natural gas more than rebounded from similar major price declines. If the fundamentals for the energy bull market are still intact, then the uranium price and uranium shares should rebound strongly as we move into next year. There isn't a great uranium exchange traded fund nor is there a basket of large caps to accurately track the sector. There is the 800-lb gorilla, Cameco. The price action of Cameco is encouraging to me. Let me explain the chart below. In the main frame we have Cameco/S&P 500 and below that we have the S&P 500 and Cameco. 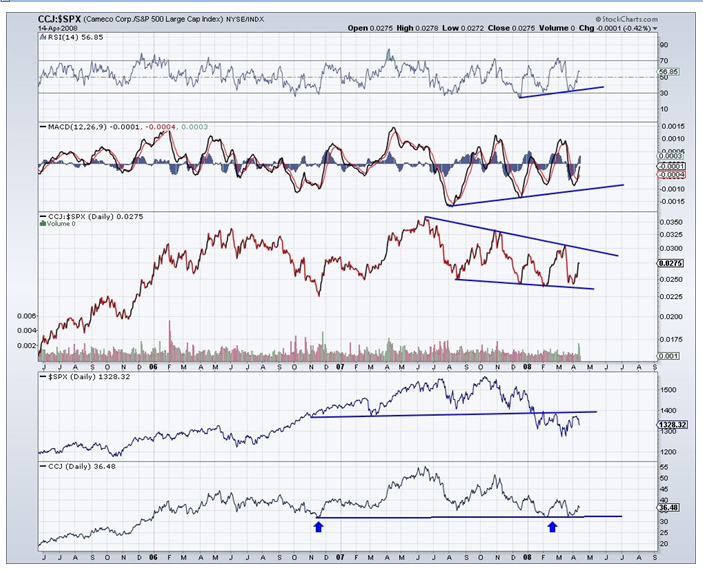
While a slight underperformer against the market, Cameco has remained healthy in technical terms. You can see positive momentum divergences developing which is a sign that Cameco should soon regain relative strength against the market. Most important is this. The stock market has broken below its many supports from late 2006 to 2007. Cameco has not. It is possible that Cameco might fall below that support in a "bear trap" or "fakeout" type move. If the fundamentals of uranium hadn't remained solid during this price correction then we would have expected to see Cameco's stock sliding more. Lastly, below is a daily chart of the Smartinvestment.ca junior uranium index. 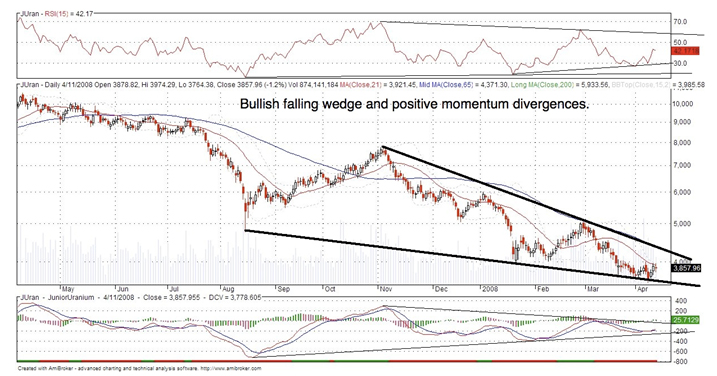
If you peer in closely you will see that it appeared a double bottom was formed back in February at 4,000. Over the past 16 days the index has fallen slightly below 4,000 but has tried multiple times to rise above. I believe once the index closes above 4,000 on consecutive days than a short to medium term bottom will have been reached. Moving further out one has to like the positive divergences in both the Macd and Rsi indicators. Also bullish is the falling wedge that has intensified in recent months. As the commodity bull rages on amidst a global economy fraught with risk and increasing uncertainty, investors need to increasingly consider the potential downside of investments. I would argue that at the current juncture the downside risk in uranium shares is much smaller than the downside risk in most other commodity shares. For technical analysis of specific uranium stocks, visit my website where a premium report can be purchased. April 20, 2008 Trendsman http://trendsman.com/ trendsmanresearch@gmail.com |
| Home :: Archives :: Contact |
TUESDAY EDITION June 9th, 2026 © 2026 321energy.com |
|