|
TUESDAY EDITION June 9th, 2026 |
|
Home :: Archives :: Contact |
|
|
The Price of Oil Keeps Falling but Energy Stocks are Not. Whats Happening?Olaf SztabaNA-Marketletter Energy www.na-marketletter.com December 7, 2008 Monday’s huge decline in Toronto and to a lesser extent in New York could squeeze the last ounce of optimism out of many bulls. Indeed, the 800-point sell-off was steep and dramatic – a valuable addition to the media’s already grim playbook. Let’s put emotions aside and focus on cyclical and technical evidence. Our last Energy Update was titled “Energy sector has drawn a firm line of support – is this the bottom in the making?” We also said that a lengthy base-building process would benefit Energy stocks at a later date. This is exactly what happened in the last two weeks. The market action has been of the tennis variety – characterized by wild swings, as traders are still reluctant to commit for the longer-term but eager to sell into rallies. The supply side is amplified by late-stage sellers, bombarded with the latest economic data, having finally hit the “I can’t take this any more” wall. The counter force comes from bargain hunters and investors ready to take a short-term risk to get a medium-term reward. The buyers, however, are careful not to push prices much higher, not just yet. As a result the Energy sector, as measured by the XOI index, remains in a range-bound trading mode. Resolution could come as early as mid-December. Both the 70-day and 39-week cycles allude to mid- or late-December as the time for an important change to occur.
Interestingly, most bear markets in history have ended in November or December. For example, the 1974 bear-market low occurred on December 6th, preceded by a momentum low on October 4th. The latest sentiment data also favours an upside resolution to the current standoff. The November 19th dip below the October 10th low contributed to a fresh bout of pessimism. The number of bulls declined to 23.1% from 29% last week and 30.9% the week before. This massive manifestation of bearishness suggests that the market participants are near the emotional climax that usually precedes a turning point. The strength of the Energy sector in the face of falling oil prices provides the most convincing argument for a turnaround (please see charts on the next page). Energy stocks usually lead the price of oil. Therefore, the fact that many big-cap Energy stocks have been challenging their 10-day moving average while oil hits new lows bodes well for the entire sector in the short- and mid-term.
The XOI index continues to conduct itself in a range-bound manner, but not for long. Cyclical and technical evidence suggest that the current standoff is coming close to a resolution. Given the recent behaviour of the index, the tide is most likely to shift toward the bulls.
OIL
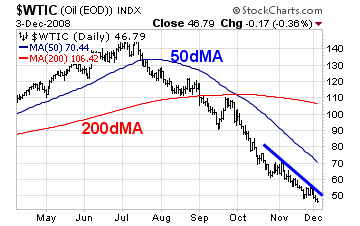 The strength of the Energy sector in the face of falling oil prices usually precedes a significant change.
These are all positives; however, for the sector to mount an enduring rally, two conditions must be met. First, the XOI index would have to break out from the current trading range and rise above the declining 50-day moving average. Second, the 50-day moving average should turn up and the index must remain above it. Meeting these two conditions would put the XOI index somewhere above the 50-day moving average with the chance of challenging the 200-day moving average.
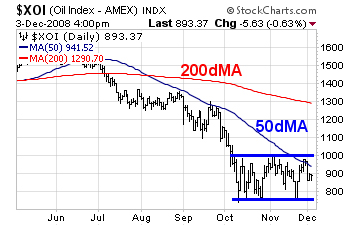 The downside risk would materialize if the XOI index decisively descends below the line of support at 750.
In sum, there has been massive technical damage in Energy stocks. The Energy sector continues to build a temporary bottom. A medium-term tradable rally may materialize shortly.
December 7th, 2008 |
| Home :: Archives :: Contact |
TUESDAY EDITION June 9th, 2026 © 2026 321energy.com |
|