|
THURSDAY EDITION February 5th, 2026 |
|
Home :: Archives :: Contact |
 |
Energy Stocks Had a Good Start but Stock Selection Remains the KeyOlaf SztabaNA-Marketletter Energy www.na-marketletter.com April 11, 2008 As we highlighted in the last Energy Comment, the fears of market collapse created an army of doubters and non-believers, worried about the so-called “Energy bubble.” The bearish ideas fell on fertile soil. The recent write-up in the Barron’s Magazine on commodities, titled “Danger Lurks” and the Economist’s front-page article, “The Crisis” are only two recent examples. It’s all music to our bullish ears! In our last Energy Update, we noted several positive technical developments, and forecast that the markets and the Energy sector in particular would begin to move higher. That move is taking place now. Market participants should watch for the following:
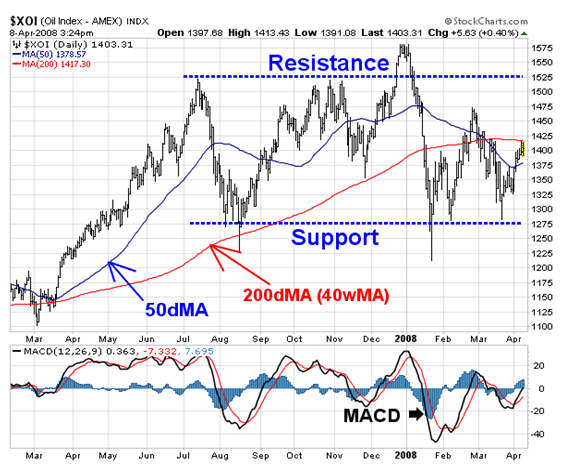
In the first weeks following the January low, the advance in the Energy sector has been very selective and lazy. The first step-up was led by a small number of stocks that managed to remain in good technical standing during the August-January correction (Encana, Imperial Oil, or Arch Coal). As expected, more stocks have recently joined the rise (Compton Petroleum, Trican Well Services or Weatherford Intl, to name a few). This reinforcement has arrived in time to give the sector a much-needed boost and allow the early leaders to pause without causing much damage to the general health of this early advance. The Energy bull appears to be flexing its muscles against a classic “wall of worry.” We said repeatedly that this new bull market will be highly selective and relatively mild compared to 2002-2007. Therefore, investors’ focus should remain on the right stocks in the leading sectors (Energy & Golds). XOI INDEX (Daily chart with the 50- and 200-day moving averages) 
The Oil index pursues its recovery, moving toward the upper line of a one-year trading range. It is encouraging that the XOI index has exceeded its rising 50-day moving average – indicating intermediate-term strength. The next challenge for the index will be the 200-day (40-week), moving average, which still provides immediate resistance. Further down the road, the index awaits solid resistance at 1475-1525 – which coincides with the upper boundary of the horizontal trading range. A decisive breakout from this range would constitute the start of a major new up-leg. Support resides near the 1275-1325 area. The index must not violate this support to retain its bullish status. April
11, 2008 |
| Home :: Archives :: Contact |
THURSDAY EDITION February 5th, 2026 © 2026 321energy.com |
|