What is next for Lt. Sweet Crude?
A long term technical analysis of the daily, weekly and monthly charts for Lt. Sweet Crude.
Erich K. Soltes
Alphatrendanalysis.com
October 29th, 2005
This is explanation of varies technical indicators that make up the Alpha Trend System.
In the lower window of the chart you will see the following indicators.
The main trend line for a security is the Alpha Trend this is denoted by the bold red line.
It is from this trend line that all other support/resistance lines are developed. The Alpha Trend is an adaptive moving average that uses proprietary mathematical formulas to create the base line movement of the selected security. From the Alpha Trend I then created three separate progression/regression price areas using Fibonacci ratios, which I call the 1st Alpha waves, 2nd Alpha waves and 3rd Alpha waves. It is these three wave areas that define the vast majority of a security’s price movement. Moving out from the Alpha Trend, the 1st Alpha waves are denoted by the dark blue lines. This is the price range that a security will normally move to once the price of the Alpha Trend line is crossed in either direction. Next are the 2nd Alpha waves which are denoted by the light blue lines. It is this area between the 2nd Alpha waves where 79.82% of the time a security‘s price will remain. Last are the 3rd Alpha waves which are denoted by the violet lines. Once a security’s price reaches this area it is in an extreme overbought/oversold condition. A security can stay in this area for awhile, but this usually represents a poor price in which to place a trade in the prevailing trend.
The next three moving averages are the one year moving average of the Alpha Trend denoted by the bold violet line, the five year moving average of the Alpha Trend denoted by the bold green line, and the ten year moving average of the Alpha Trend denoted by the bold black line. Each of these moving averages is set for the different time frames of a chart. On the daily chart the one year moving is 240 days, the five year is 1200 days and the ten year is 2400 days. On the weekly charts the one year moving average is 52 weeks, the five year moving average is 260 weeks and the ten year moving average is 520 weeks. Lastly, for the monthly charts the one year moving average is 12 months, the five year moving average is 60 months and the ten year moving average is 120 months.
In the upper window is my own relative strength indicator denoted by the bold blue line. This indicator measure the strength of the trend, “0” is overbought and “-100” is oversold. This indicator measures the strength of the price movement between the 3rd Alpha waves.
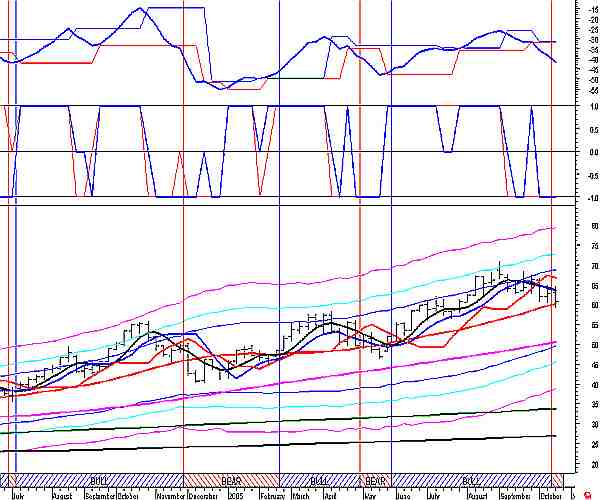
Above is the daily chart for Lt. Sweet Crude Oil.
Since September 22, 2005 oil has been bearish and has made three attempts to stay above the Alpha Trend line. Oil is currently retreating to the 1st Alpha wave band price of $58.58. Once oil gets near this support price it should hold. If Oil can find a bottom around the $58.58, it should rally back towards the Alpha Trend line price currently at 64.01. Since the start of the year ever time Oil has pulled back to the 1st Alpha wave band it has held. For this retreat to be the same, the relative strength indicator will have to turn up in the next few days. If the 1st Alpha wave band doesn’t hold the next support price is the 2nd Alpha wave band price currently at $56.50.
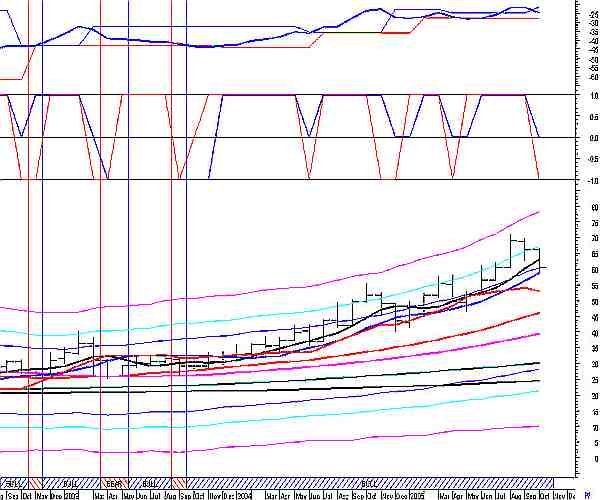
Above is the weekly chart for Lt Sweet Crude.
This week Lt Sweet Crude just turned bearish for the first time since June 6, 2005. During the week oil went as low as 59.15 then rallied back to close above the Alpha Trend line. The relative strength indicator is moving down, and is has not yet reached an oversold position. The position for the last three weeks has been short and the running stop loss price is 63.38. If Oil can’t hold above the Alpha Trend line price of 60.13 this bearish trend will continue, with the price of oil moving to the one year moving average of the Alpha Trend support price of 50.43. For this bearish trend to change the relative strength indicator needs to turn up and oil’s price needs to close above the resistance price level of 63.56. The one year moving average of the Alpha Trend has held since December 05, 2003 this is a major support line. There is a very low probability that oil will fall below this level in the near term.
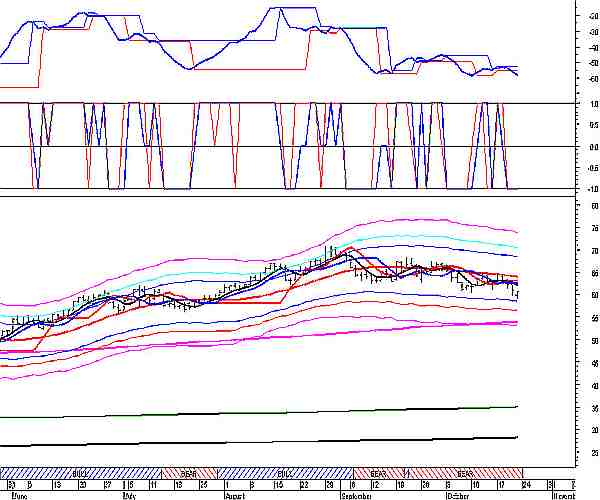
Above is the monthly chart for Lt. Sweet Crude.
Oil has been in a bullish trend since October 31, 2003. This past week Oil was able to remain above the upper 1st Alpha wave band price of 60.38. On the monthly chart the relative strength indicator is moving down and the price is currently below the short term alpha trend price of 62.96. Currently the monthly chart is indicating that Oil has been weakening since August. However, the bull trend is still in place and should remain so until Oil closes below the Alpha Trend price of 46.05.
In conclusion, the Daily and Weekly charts both have Oil in a bearish trend. This week oil should continue moving down to the weekly support price 60.13, and if that supports fails to hold the next support price is from Daily chart’s lower 1st Alpha wave band support price of 58.58. If the 58.58 support fails to hold the next support price after that is 56.50. There is a very good chance that 58.58 support trend price should hold. Currently, the resistance price area for Oil is 63.30 – 64.01 after the bottom is found Oil should rally back up to this price area.
Erich K. Soltes
October 29th, 2005
Alphatrendanalysis.com
To learn more about the Alpha Trend System please visit alphatrendanalysis.com.
This site provides a daily analysis and charts for the following futures: 10 year Bond, 30 Bond, CRB Index, Gold, Lt Sweet Crude, Natural Gas, Silver, US Dollar, Unleaded Gas and the following and stock indices; Dow Jones Industrial, Dow Jones Transportation, Dow Jones Utilities, NASDAQ Composite, S+P 500 and the XAU Index.
About Erich Soltes
A graduate of Brookfield High School in Brookfield CT and an Eagle Scout, Erich went on to graduate from SUNY Maritime College in New York City in 1988, with a BS in Marine Transportation and a minor in Economics. For the next ten years he was a Navel Reserve officer and a Merchant Marine officer. In 1998 he went to work on Wall Street obtaining his series 7, 63 and 65 licenses. He worked both as a stockbroker and a financial planner helping clients obtain their financial goals. In 2004 he was able to finally reach his goal of developing a mathematical trading model that could beat the “buy and hold” method of investing. In mid 2005 the Alpha Trend Analysis website that you see before was created.
DISCLOSURE
Erich K. Soltes is the Owner of Alpha Trend Analysis, which contains the opinions of Erich K. Soltes, and is provided for informational purposes only. Neither Erich K. Soltes nor Alpha Trend Analysis, provide individual investment advice and will not advise you personally concerning the nature, potential, value, or of any particular stock or investment strategy. To the extent that any of the information contained in this article may be deemed investment advice, such information is impersonal and not tailored to the investment needs of any specific person. Past results of Alpha Trend Analysis, or Erich K. Soltes are not necessarily indicative of future performance. Erich Soltes, entities that he controls, family, and associates , may have positions in securities mentioned in this article and may close them at any time.
Alpha Trend Analysis, does not represent the accuracy nor does it warranty the accuracy, completeness or timeliness of the statements made on its web site or in its email alerts. The information provided should therefore be used as a basis for continued, independent research into a security referenced in this article so that the Subscriber forms his or her own opinion regarding any investment in a security mentioned in it. The Subscriber therefore agrees that he or she alone bears complete responsibility for their own investment research and decisions. We are not and do not represent ourselves to be a registered investment adviser or advisory firm or company. You should consult a qualified financial advisor or broker before making any investment decision and to help you evaluate any information you may receive from this article.
Consequently, the Subscriber understands and agrees that by using any of Alpha Trend Analysis services, either directly or indirectly, Alpha Trend Analysis, shall not be liable to anyone for any loss, injury or damage resulting from the use of or information attained from Alpha Trend Analysis or any of its services.