|
TUESDAY EDITION December 30th, 2025 |
|
Home :: Archives :: Contact |
 |
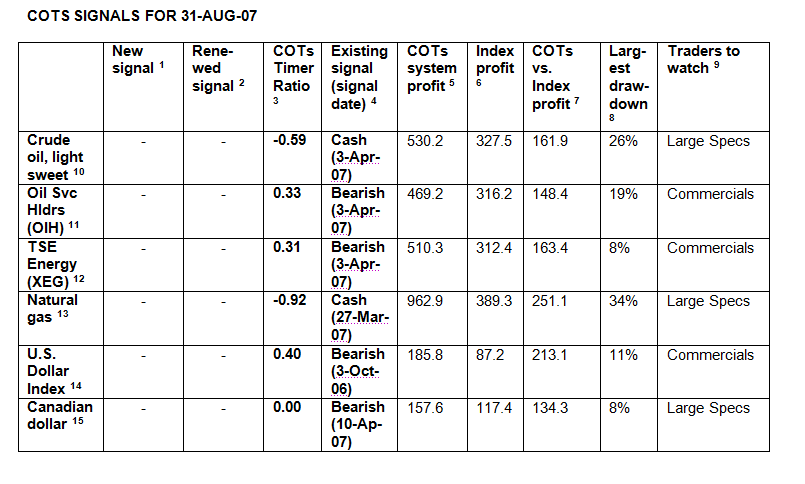
COTs Still Bearish Energy StocksBy Alex Roslin September 7, 2007 www.COTsTimer.Blogspot.com Is the market bloodbath over? Are energy stocks back on solid ground, or are we in the middle of a sucker trap? The doomsday talk has quieted down a little, and most of the energy sector has staged a sweet little recovery since the August lows. That’s of course with the exception of natural gas, off fully 30 percent since June. In times of turbulence like these, many analysts and traders turn for guidance to the Commitments of Traders reports issued by the U.S. Commodity Futures Trading Commission. This valuable government data lists trillions of dollars in futures and options holdings of many of the world’s largest traders—commodity producers (the so-called “smart money” insiders, who often have the next market information), investment firms and hedge funds (usually, the wrong-way “dumb money” traders) and the small fry folks like you and me (also usually positioned badly). So what did the latest COTs report—issued August 31 and based on data as of Aug. 28— have to say about energy markets? The traders I follow remain bearish on energy stocks and neutral on crude oil and natural gas. They are also bearish the Canadian dollar—the world’s leading petro-currency—and U.S. dollar index. Friday’s data also didn’t show any historic extremes of positioning that would have given me a new or renewed signal in any of these markets. (See the table below for more details and my free blog COTsTimer.Blogspot.com to learn more about how my system works.) There were, of course, some interesting, smaller fluctuations in the latest data. You’ll often read about such minor COTs position changes in media reports. But anyone who’s tested the correlation of the week-to-week changes with price movements can tell you there’s virtually nothing tradable there. It’s not like lots of smart folks haven’t tried to find a connection. But many years of such attempts have been fruitless. Extreme Positions I think the key to understanding the COTs data, as authors like Larry Williams have suggested, is to look for the points when traders hit extremes that suggest a new trend is imminent. Let’s say the “smart money” commercials are building historic net long positions in crude week after week. That may suggest crude is about to take off. Most traders say the COTs data is best used a guidepost to possible market action, but they suggest timing trades requires other tools like technical analysis. I found that’s not so. My own twist on this data was to backtest the specific historic extremes that led to tradable opportunities. I then subjected those setups to statistical testing to see if we could have confidence that the market-beating profitability of those results wasn’t due just to chance. I also tested not just the commercials—the traders most analysts watch—but also the large specs and small traders to see which were really the best to follow. I was surprised to see that in some markets—for example, natural gas—it was actually best to trade on the same side as the large specs and small traders. In every market I’ve examined using this approach, I found a setup that gave superior, statistically robust results. Buy and sell signals came from a combination of moving averages and standard deviations to identify tradable extreme points in trader positioning. Other Highlights Some other highlights from the Aug. 31 COTs report: - Crude oil: Large specs—whom I fade in this market—have been reducing their net long percentage-of-open-interest position for four weeks and have now adopted a fairly bearish tilt compared to recent historic data. They’re still not extreme enough, however, to reverse my existing neutral signal. (See note 10 for more info on this setup.) - Energy stocks: The commercials—whom I follow for Oil Services Holders and the Canadian Energy iUnits ETF (XEG)—are leaning more and more bullish, though again not enough yet to reverse my short signal here. - Natural gas: Large specs—the “smart money” in this market, believe it or not—have reduced their net short percentage-of-open-interest position for four weeks. However, they remain highly bearish, having just given 13 consecutive bearish signals according to my setup for natural gas. Thus, I remain neutral. (See note 13 for more info on this setup.) For my COTs signals in equities, financials and other commodities and currencies and to see how my system works, visit my free blog at COTsTimer.Blogspot.com. Good luck in your trading and investing. 
NOTES TO TABLES
By Alex Roslin September 7, 2007 www.COTsTimer.Blogspot.com Disclaimer This report isn't meant as financial advice or a recommendation to buy or sell any security. Please do your own homework before trading. My system isn't for everyone, involves substantial risk and has experienced large drawdowns in some past trades. Past results are no guarantee of future profits. I'm not a certified financial advisor. While I consider my information to be reliable and accurate, I make no guarantees. Please see COTsTimer.Blogspot.com for other disclaimer information. |
| Home :: Archives :: Contact |
TUESDAY EDITION December 30th, 2025 © 2025 321energy.com |
|