Estimating the World Production Decline Rates from the Megaproject Forecasts
from The Oil Drum :: posted by Khebab
November 20th, 2007
Oil production is highly pyramidal and almost half of the world production is coming from less than 3% of the total number of oilfields. Therefore, tracking large oil projects seems like a good approach and it is generally easy to gather good information about a few hundreds of important projects. The most notorious studies are from Chris Skrebowski (ODAC) that has tracked megaprojects since 2004 (see references at the bottom of this post). Initially, only projects that could produce 100 kbpd and more were included. In 2007, the last update included also 40,000 bpd and more. However, forecasted increases in new production capacity have been overly optimistic. So what went wrong? They are many possible causes: demand destruction due to high prices, significant project delays, withheld capacity, larger decline of the resource base, etc..
Having a good estimate of the decline rate of the resource base (Most estimates are ranging between 2 and 6%/year) is fundamental for the precision of supply forecasts derived from megaproject database (see Rembrandt's recent post). Stuart is also looking at this problem here.
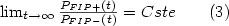
In the following, I assume that I have information about the amount of supply coming from megaprojects for years beyond the year t0. For t >t0, the total oil production will be decomposed in the following components:

Where:
- PFIP+: is the
contribution from
fields that were online prior to t0
and that are still
experiencing
production growth or at least a production plateau for the
year t>t0.
- PFIP-: is the total
contribution
from
fields that were online prior to 2004 and that are in decline for t>t0 .
- PMegaProj: is the
total contribution
from new supply additions from megaprojects.
- PSmallProj: is the
total
contribution from new supply additions from small projects.
If we remove the contribution from MegaProjects, we define a production erosion as following

Eventually, after a few years depletion will dominate and most fields will be in decline:
Fields in decline will follow an exponential decline with a constant rate

However, fields that have not reached their peak production before will have a non stationary decline rate

The initial decline for the
FIP+ group the will
be slower but will eventually converge toward
the average decline rate of
FIP-
In the following, I'll try to validate the above assumptions on the UK production database.
A Look at the UK
The UK is one of the only country in the world (along with Norway) that
has a
detailed public production dataset per field. Therefore, the UK will be
our benchmark that can help us partially validate the above model
(original idea from Euan). Figure 1 shows an example
of production erosion for
t0=1998.
However, this analysis is assuming that there is no contributions from
small projects (i.e.
PSmallProj(t)=0 for
t>t0).
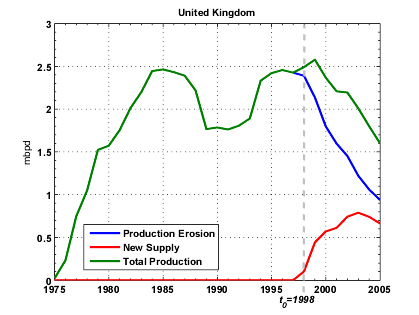
Fig 1. Example of production erosion obtained by removing new supply additions past 1998.
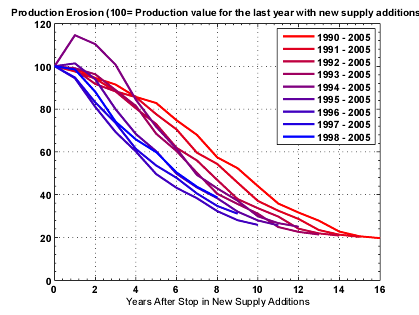
Fig 2. Normalized Production erosion profiles for various t0.
Production erosion rates are initially positives and then drop rapidly within a few years toward a minimum decline rate.
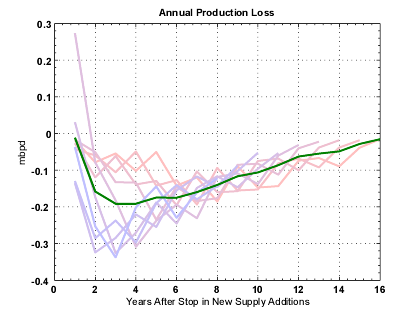
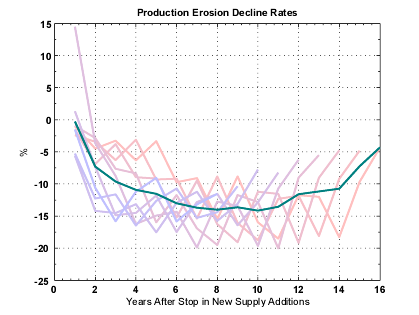
Fig 3. Observed production erosion for the UK when t0 varies between 1990 and 1998. The green
curve is the average value.
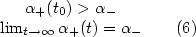
In order to validate relations (3) to (6), fields are split
in two
groups, FIP+ and FIP-,
according to whether or not they have reached their production
peak before t0. Observed
average decline rates for FIP+ appear to decline quickly from α+=40%
toward negative values and remain nearly constant to a value close to
-15% (Figure 4). Decline rates for FIP- are remaining relatively constant around α-=-15%.
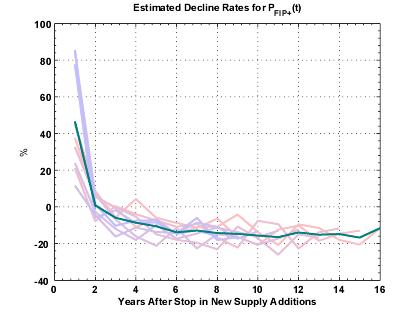
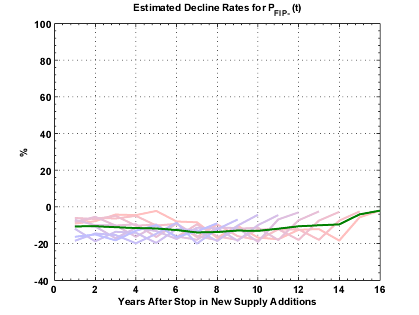
Fig 4. Production erosion annual decline rates for PFIP+ (fields in production that have not reached their
production maximum before t0)
and PFIP- (fields
in production have reached their production maximum before t0).
Another interesting observation is that the production decline post t0 can be closely modeled by a logistic curve which
parameters are estimated using the Hubbert Linearization on
production
prior to t0. On
Figure 5,
we can see that there is a good correlation between the logistic model
and the actual
production erosion especially when t0 <
1994 (a corollary conclusion could be also that the Hubbert
Linearization is underestimating future supply additions as suggested
by Euan).
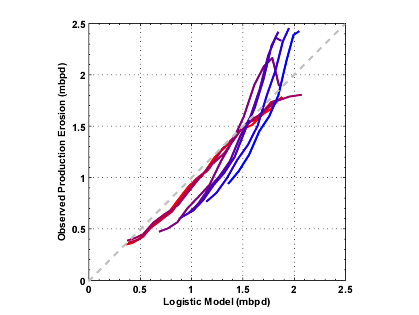
Fig 5. Observed production erosion and logistic model derived from the Hubbert Linearization technique.
Estimating Production Erosion for the World based on the MegaProject Database
The methodology is pretty much the same as the one Stuart employed at the difference that we performed a Monte-Carlo procedure which enable us to inject some degree of uncertainty on the megaproject numbers.
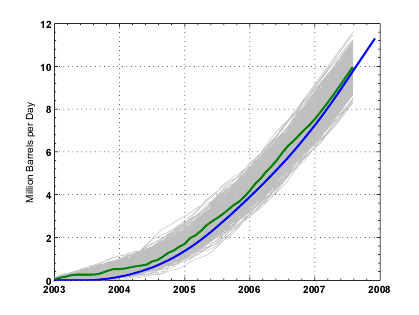
Fig 6. Skrebowski's cumulative new supply additions taken from the 2007 MegaProjects update (blue line) and one variant produced by adding random time delays (uniform +/- 1 year) and production noise (Gaussian noise centered with standard deviation equals to 0.25 mb). In gray, is the domain explored by the Monte-Carlo procedure (500 runs).
The estimated production erosion is shown on Figure 7. The estimated decline rates are linearly increasing over the observation period with an annual increase of 2.9% per year.
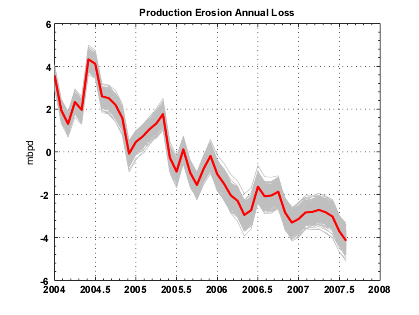
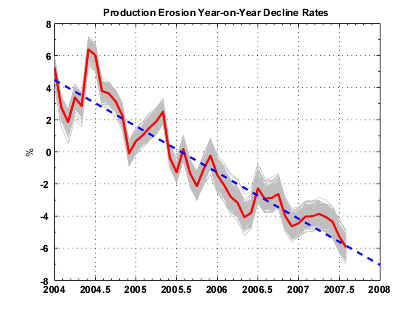
Fig 7. Estimated Annual loss due to Production Erosion (left) and corresponding annualized rates (right). In blue is the linear regression (slope equals to -2.9%/year). In gray, are the range of the estimates (500 runs) and in red the average value.
Having observed on the UK that the logistic model seems to be a good model for forecasting future production erosion, I estimated the logistic model for the world production.
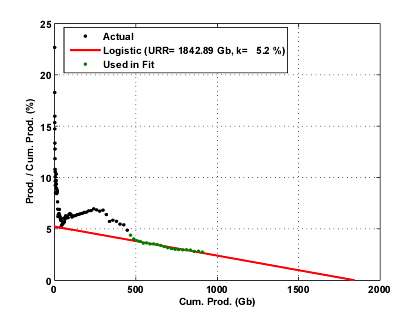
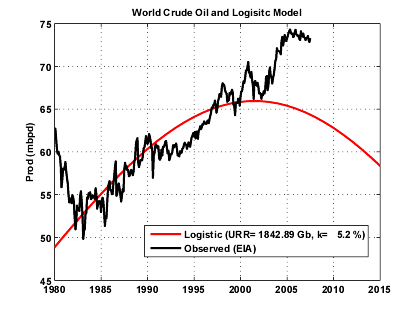
Fig 8. Hubbert linearization applied on the World crude oil + condensate production (EIA data). Only years 1980-2001 are used for the fit.
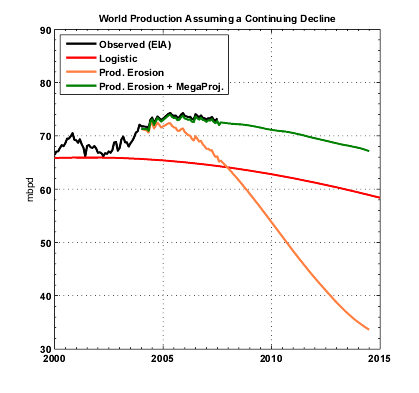
What's intriguing is that the estimated production erosion (in orange on Figure 9) intersects the logistic curve in 2007. On Figure 9, we are showing different decline scenarios:
- The exponential production erosion scenario assumes that the decline rate will stay constant from 2007 (-4.5%).
- The Accelerated exponential decline has a linearly increasing decline rate according to the blue line shown on Figure 7.
- The logistic scenario is the accelerating decline between 2004-2007 then a logistic decline after 2007.
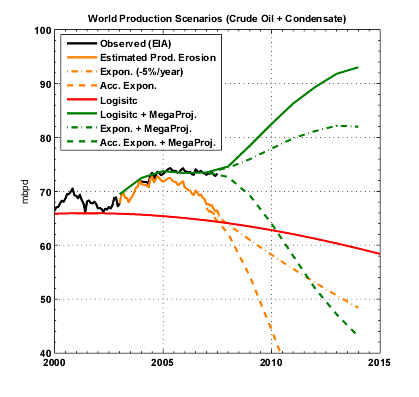
Fig 9. Various scenarios for the world production.
If we look at the production plateau for crude oil from 2005 to 2007, one can notice that the production profile is almost parallel to the logistic curve. Based on this observation, I assumed that the current plateau will continue with a slight downward slope following the logistic decline (see Figure 11). In that case, the production erosion rates are slowing down after 2007 and are reaching a bottom value around -10% in 2012.
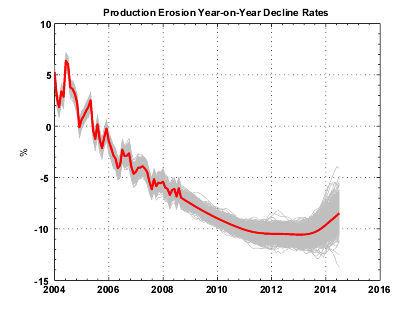
Fig 10. Estimated Production Erosion annualized rates . In gray, are the range of the estimates (500 runs) and in red the average value.
 >
>
Fig 11. Estimated production erosion assuming a logistic decline for the world production.
Impact of Saudi Arabia Hypothetical Withheld Production
Since August 2005, production from Saudi Arabia has declined by 1 mbpd and is now around 8.7 mbpd (see Figure 12). The question of whether or not this decline is voluntary has been the center of intense
debates on TOD. Let's assume that Saudi Arabia would have maintained production constant at 9.6 mbpd since August 2005, the decline rates (Figure 13) would have been slightly less important around -3% for 2007 as well as the acceleration (-2.5%/year).
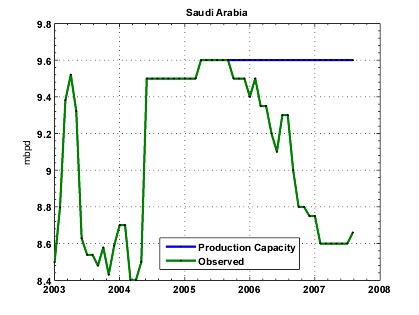
Fig 12. Saudi Arabia crude oil production since 2003 (EIA).
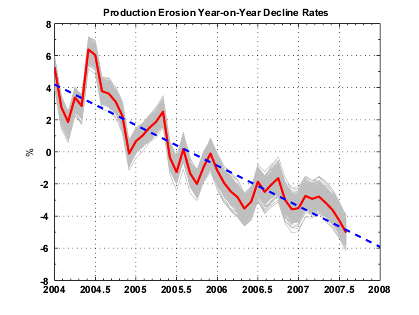
Fig 13. Estimated Production Erosion annualized rates assuming that Saudi Arabia would have maintained production constant since 2005. In gray, are the range of the estimates (500 runs) and in red the average value.
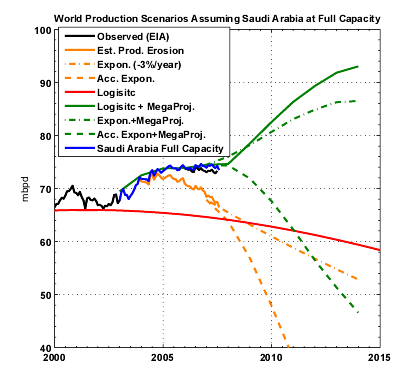
Fig 14. Estimated production erosion and megaproject contribution assuming that Saudi Arabia would have maintained production constant since 2005.
Summary
- We defined production erosion as the production decline of the resource base (+small new projects) resulting from the removal of the contribution from megaprojects.
- We modelised production erosion as a simple sum of three components (FIP+, FIP-, Small projects) which are presenting different decline rates.
- Looking at the UK data as a benchmark:
- we observed that the annual decline rates for the production erosion are not stationary in the first years following the removal of future new supply additions. The decline rate goes from positive values to negative values in just one year and is converging toward a low negative value in 6-8 years.
- the decline rates for FI P+ are not stationary for the first 6-8 years but then are reaching an asymptote.
- the estimated decline rates for FIP- are relatively constant over the years.
- The World production (crude oil + condensate) is almost flat since 2005, however almost 6 mbpd of new supply from megaprojects have been added. We tried to evaluate what is the implication for the underlying decline coming from the post-2005 resource base:
- World production erosion is exponential with a linearly increasing decline rate between 2004 (+4%) and 2007 (-4%) showing no sign of slowing down.
- This accelerating decline is probably the effect of the FIP+ group as we observed for the UK production. The fact that the decline rates seem to be so high is probably a sign that the current world production levels are exceedingly reliyng on new megaprojects in order to maintain production.
- If we assume that crude oil production will continue its slow decline started in 2005 (Figure 11), this implies that decline rates may reach a low around -10%/year around 2010.
- We have absolutely no information on the contribution coming from small projects (probably thousands of them?). However, the fact that we have not removed this contribution should have produced more conservator decline rates.
- The effect of high prices on demand and withheld production in particular from some OPEC producers may bias this analysis.
- Megaproject forecasts are probably excessively pessimistic beyond 5 years simply because the information is not available yet (what we call the horizon effect).
from The Oil Drum :: posted by Khebab
November 20th, 2007