Peak Oil Update - October 2006:
Production Forecasts and EIA Oil Production Numbers
from The Oil Drum :: posted by Khebab
October 17th, 2006
An update on the last production numbers from the EIA along with different oil production forecasts.
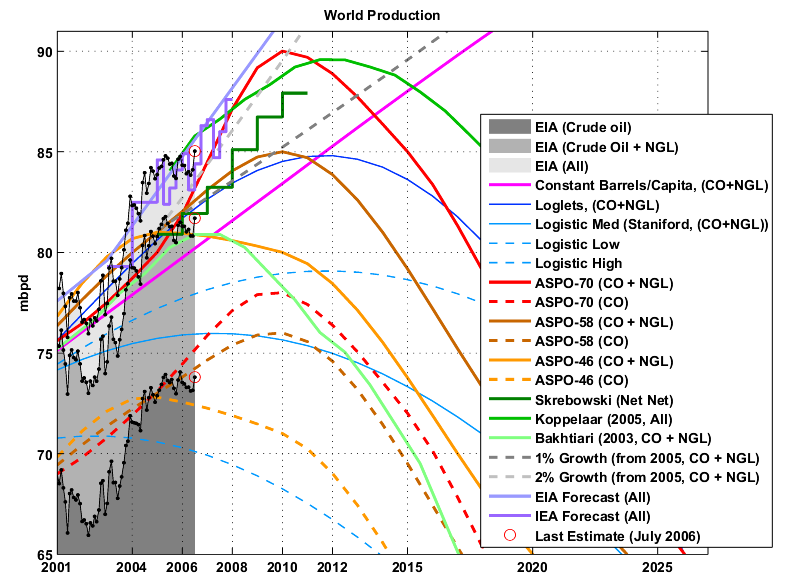
Fig 1.- World oil production (EIA Monthly) and various forecasts (2000-2020).
Data sources for the production numbers:
- Production data from BP Statistical Review of World Energy 2006 (Crude oil + NGL).
- EIA data (monthly and annual productions up to July 2006) for crude oil and lease condensate (noted CO) on which I added the NGPL production (noted CO+NGL).
Most of the datasets above are compiled in an EditGrid spreadsheet.
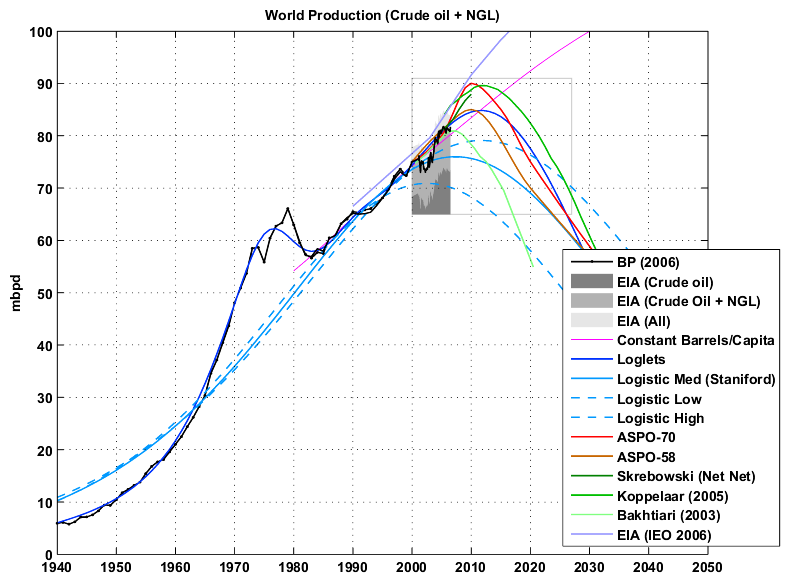
Fig 2.- World oil production (Crude oil + NGL) and various forecasts (1940-2050).
Business as Usual
- EIA's International Energy Outlook 2006, reference case (Table E4).
- IEA total liquid demand forecast for 2006 and 2007 (Table1.xls).
- A simple demographic model based on the observation that the oil produced per capita has been roughly constant for the last 26 years around 4.4496 barrels/capita/year (Crude Oil + NGL). The world population forecast employed is the UN 2004 Revision Population Database (medium variant).
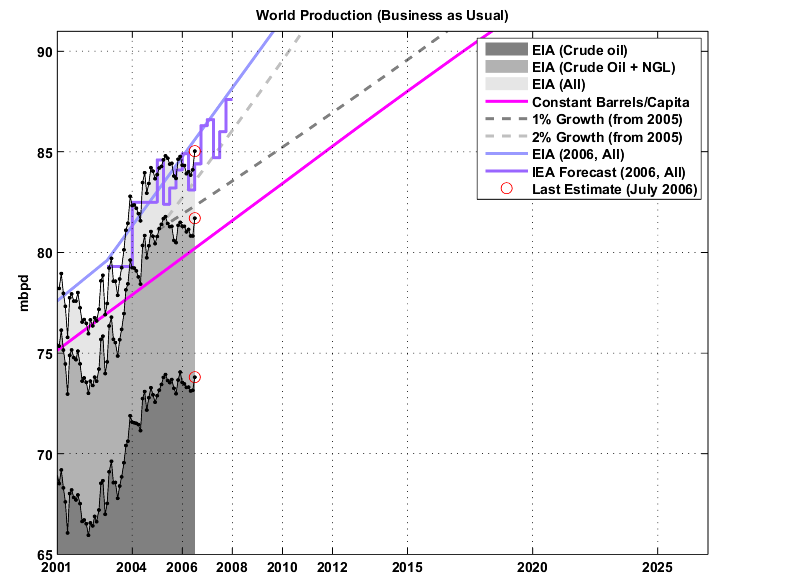
Fig 3.- Production forecasts assuming no visible peak.
PeakOilers: Bottom-Up Analysis
- Chris Skrebowski's megaprojects database (see discussion here).
- The ASPO forecast from the last newsletter (#70): I took the production numbers for 2000, 2005, 2010, 2015 and 2050 and then interpolated the data (spline) for the missing years. I added the previous forecast issued one year and two years ago (newsletter #58 and #46 repectively). There was no revision since August 2006.
- Rembrandt H. E. M. Koppelaar (Oil Supply Analysis 2006 - 2007): "Between 2006 and 2010 nearly 25 mbpd of new production is expected to come on-stream leading to a production level of 93-94 mbpd in 2010 with the incorporation of a decline rate of 4% over present day production".
- Koppelaar Oil Production Outlook 2005-2040 - Foundation Peak Oil Netherlands (November 2005 Edition).
- The WOCAP model from Samsam Bakhtiari (2003). The forecast is for crude oil plus NGL.
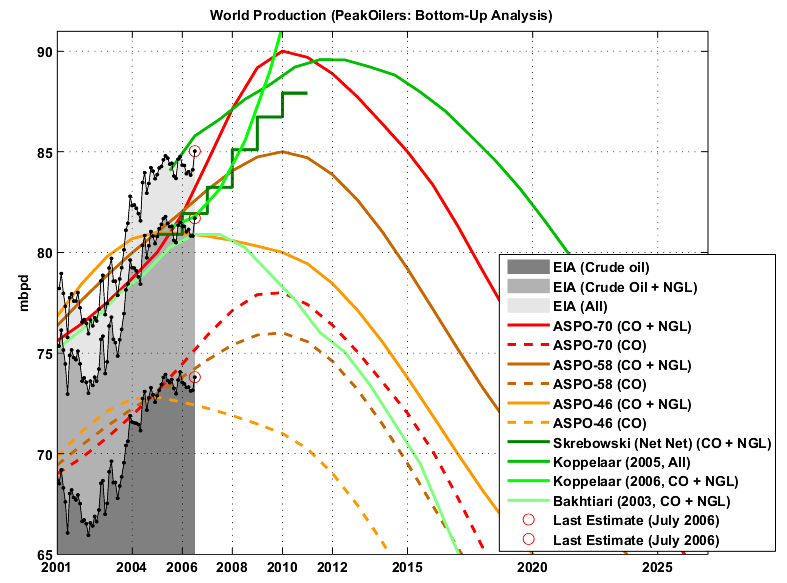
Fig 4.- Forecasts by PeakOilers based on bottom-up methodologies.
PeakOilers: Curve Fitting
The two following results are for Crude Oil plus NGL (CO+NGL) production:
- Logistic curves derived from the application of Hubbert Linearization technique by Stuart Staniford (see this post).
- Results of the Loglet analysis.
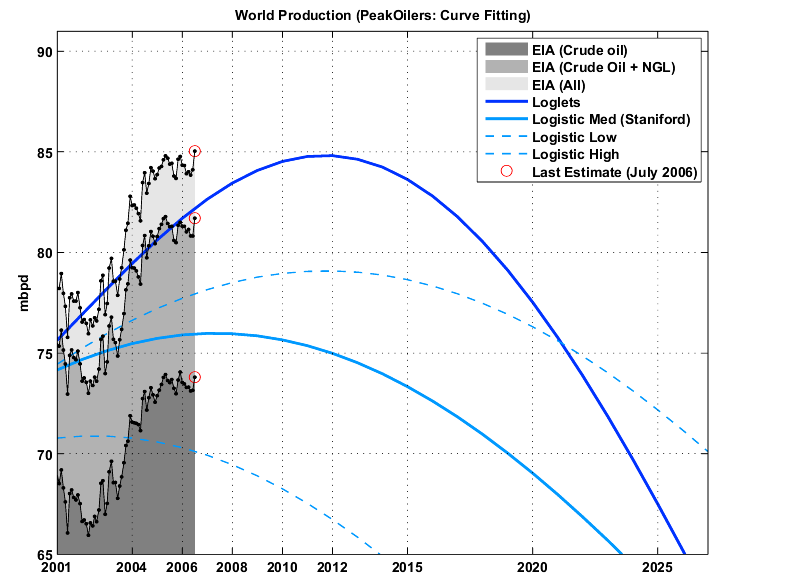
Fig 5.- Forecasts by PeakOilers using curve fitting methodologies.
Production Growth
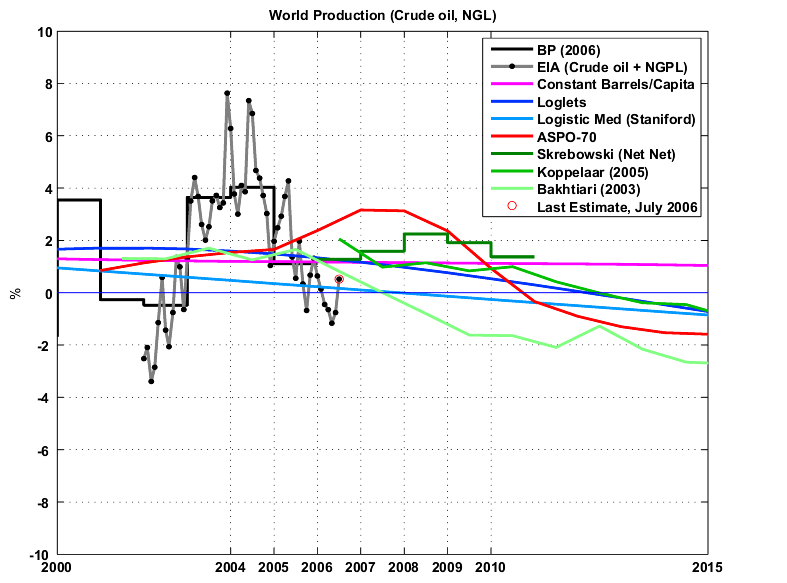
Fig 6.- Year-on-Year production growth.
| Forecast | 2005 | 2006 | 2010 | 2015 | Peak Date | Peak Value |
|---|
| All Liquids |
|---|
| Observed (EIA) | 84.34 | 84.22 | NA | NA | 2006-07 | 85.03 |
| Koppelaar (2005) | 84.06 | 85.78 | 89.21 | 87.98 | >2012 | 89.58 |
| Koppelaar (2006) | 81.23 | 81.78 | 93.50 | NA | > 2012 | > 93.0 |
| EIA (IEO, 2006) | 82.70 | 84.50 | 91.60 | 98.30 | ? | ? |
| IEA (2006) | 83.38 | 84.40 | NA | NA | ? | ? |
| Crude oil + NGL |
|---|
| Observed (EIA) | 81.23 | 81.15 | NA | NA | 2005-05 | 81.77 |
| ASPO-70 (2006-10) | 80.00 | 81.90 | 90.00 | 85.00 | 2010-01 | 90.00 |
| ASPO-58 (2005-10) | 81.00 | 82.03 | 85.00 | 79.18 | 2010-01 | 85.00 |
| ASPO-46 (2004-10) | 81.00 | 80.95 | 80.00 | 73.77 | 2005-01 | 81.00 |
| Bakhtiari (2003) | 80.24 | 80.89 | 77.64 | 69.51 | 2006-07 | 80.89 |
| Skrebowski (2003) | 80.90 | 81.42 | 87.32 | NA | > 2010 | ? |
| Staniford (High) | 77.21 | 77.72 | 78.95 | 78.64 | 2012-01 | 79.08 |
| Staniford (Med) | 75.73 | 75.89 | 75.65 | 73.33 | 2007-01 | 75.97 |
| Staniford (Low) | 70.58 | 70.29 | 68.25 | 63.89 | 2002-01 | 70.86 |
| Loglets | 80.62 | 81.69 | 84.52 | 83.62 | 2012-01 | 84.80 |
| Constant barrels/capita | 78.81 | 79.73 | 83.42 | 88.01 | 2050-01 | 110.64 |
| Crude oil + lease condensate |
|---|
| Observed (EIA) | 73.49 | 73.38 | NA | NA | 2005-12 | 74.05 |
| ASPO-70 (2006-10) | 73.10 | 74.45 | 78.00 | 72.00 | 2010-01 | 78.00 |
| ASPO-58 (2005-10) | 73.00 | 73.80 | 76.00 | 69.50 | 2010-01 | 76.00 |
| ASPO-46 (2004-10) | 72.80 | 72.56 | 71.00 | 63.55 | 2005-01 | 72.80 |
Table I. Summary of all the forecasts (figures are in mbpd) as well as the last EIA estimates.
from The Oil Drum :: posted by Khebab
October 17th, 2006