|
WEDNESDAY EDITION July 15th, 2026 |
|
Home :: Archives :: Contact |
|
|
The European Gas MarketEuan Mearns December 13, 2007 www.theoildrum.com/user/Euan+Mearns OECD European gas production looks set to peak in 2008. After that, falling production combined with rising demand will see OECD European gas imports wanting to rise from current 197 BCM per annum to 442 BCM per annum by 2020. Where will this gas come from and how will rising European imports affect N America and the rest of the world?  Figure 1 OECD Europe gas production and conceptual forecast. Executive summary
This post will provide a production forecast for Europe's main gas producers (the UK, The Netherlands and Norway); it will examine existing import patterns in Europe's main gas consumers (Germany, Italy and France) and the ability of gas exporters to meet growing OECD European demand - Egypt, Libya, Algeria, and in particular Russia. This article was initiated as part of study of UK gas security. The UK faces rapidly falling gas production and an equally rapid expansion of imports and the key question for the UK is where will this gas come from? This will be dealt with in a separate post. There are a number of ways to divide Europe for economic analysis. I have chosen to break out data for European states that are members of the OECD. This includes the important oil and gas producer Norway, which is not a member of the European Union (EU) but excludes the Baltic States, Romania and Bulgaria which are EU members but have not yet joined the OECD. 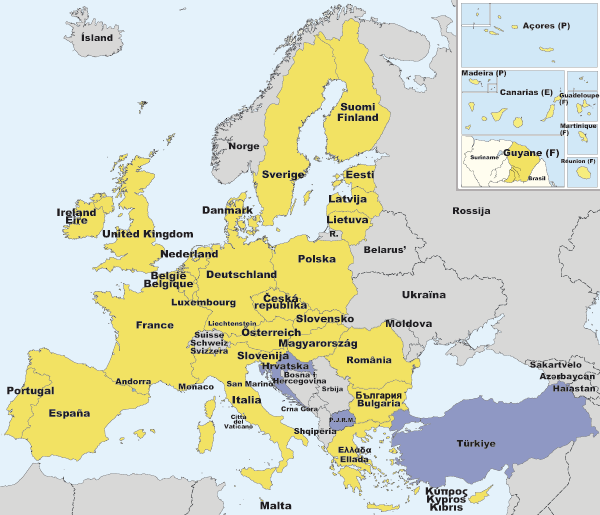 Figure 2 Map of the European Union. Turkey is a member of the OECD but lies mainly outside of Europe and is not included in this study. Turkey is a major importer of gas, especially from Russia. Data sources and gas units Throughout this article I have used data from the 2007 BP Statistical Review of World Energy. I have also used billion cubic metres (BCM) as the standard unit for gas measurement. According to BP, 1 BCM is equivalent to: -35.3 billion cubic feet (BCF) -0.73 million tonnes of liquified natural gas (LNG) -36.0 trillion British Thermal Units (BTU) -6.29 million barrels oil equivalent (BOE) Gas production forecast OECD Europe gas production is dominated by three countries - the UK, The Netherlands and Norway, with lesser but significant quantities produced by Denmark, Italy, Poland and Germany. 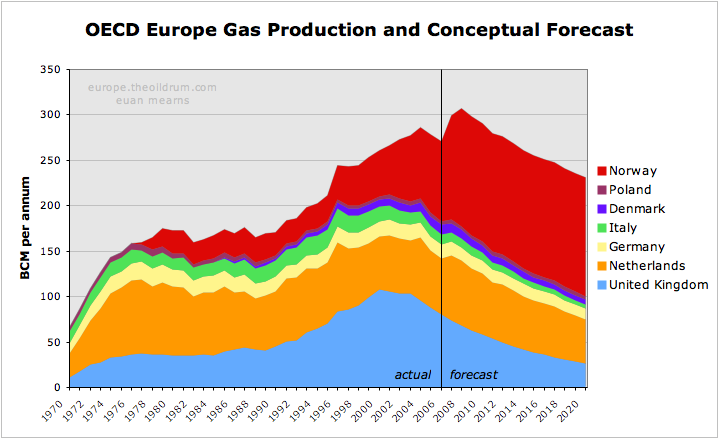 Figure 3 OECD Europe gas production and conceptual forecast. The UK The changing face of gas production in the UK lies at the heart of Europe's emerging gas problem. In 2003, the UK was a net exporter of gas to Europe but with peak production in 2000 and production now falling at 8.7% per annum it had become a net importer by 2004. The challenge facing the UK gas industry will be the subject of a detailed post. 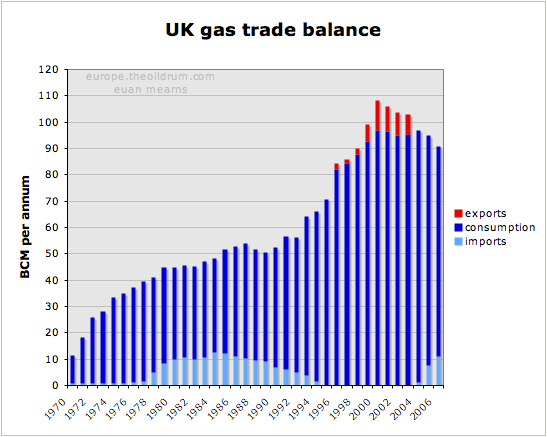 Figure 4 UK gas production and consumption history The UK forecast is based simply on extrapolating the 8.7% decline to 2020 by which time production is forecast to be 26 BCM per annum. At peak in 2000, the UK produced 108 BCM per annum and in the space of 20 years the UK will have gone from net exporter to a major importer, being dependent upon imports of over 80 BCM per annum. This view on decline of UK gas production is shared by the UK BERR (Department for Business and Enterprise Regulatory Reform - formerly the DTI). See for example Figure 5.2 in this report. The Netherlands The Netherlands is home to OECD Europe's largest gas field. Discovered before WWII, the full extent of the Slochteren Field did not become apparent until the post-war years. It was the discovery of this field in the Permian Rotliegendes sandstone that sparked the exploration for gas and then oil in the North Sea. 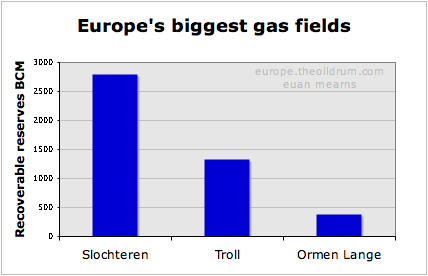 Figure 5 Europe's largest gas fields. Data for Slochteren from Rembrandt Koppelaar. Troll and Ormen Lange from the NPD. Slochteren lies onshore in the Groningen area of northern Holland and dwarfs the giant Norwegian gas fields of Troll and Ormen Lange. Further fields were found around Slochteren in the on-shore and off-shore areas. Slochteren was never produced flat out and the Dutch government has laterally set a production cap on the field. In the period 2006 to 2015 this cap is set at 425 BCM over the 10 year period. NAM (the Shell - Exxon operating consortium) can optimise production over this time frame but strictly within this overall limit. The production cap on Slochteren has resulted in a long drawn out production plateau analagous to that seen in the Saudi super giant oil fileds - a very enlightened production strategy on behalf of the Dutch government. 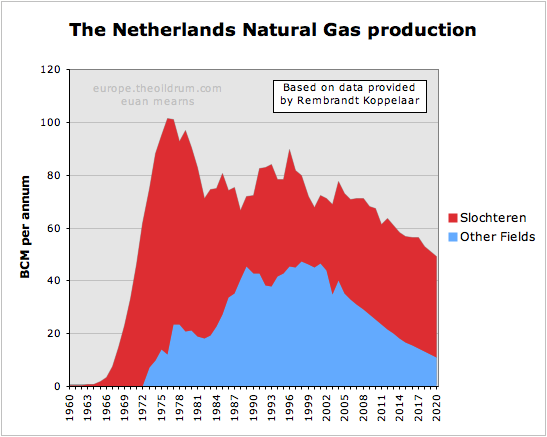 Figure 6 Dutch gas production and forecast based on data provided by Rembrandt Koppelaar. The smaller offshore fields are showing a decline similar to the UK. Note that the volumes here are substantially larger than quoted by BP (see Figure 7). Rembrandt suggested this could be due to adjustment by BP for the energy content of the gas. The other fields were not subject to regulation and are now in decline in similar manner to the UK gas fields. According to Rembrandt, Slochteren will also begin to decline naturally after 2015 and the bottom line is that Dutch gas production is now in an irreversible decline phase. The forecast for the Netherlands is based on data kindly supplied by Rembrandt. This has smaller fields declining at a similar rate to the UK, while Slochteren has a somewhat lower decline rate. 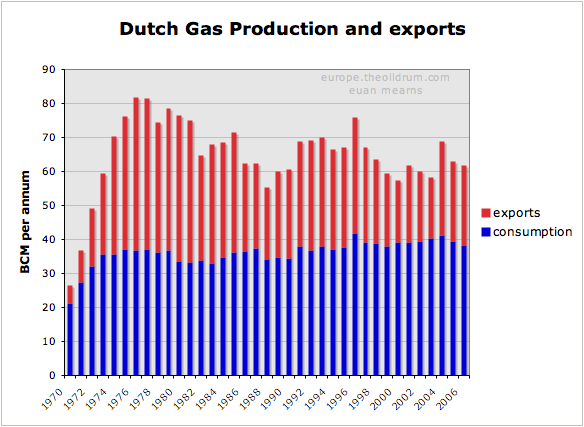 Figure 7 History of Dutch gas production and exports. 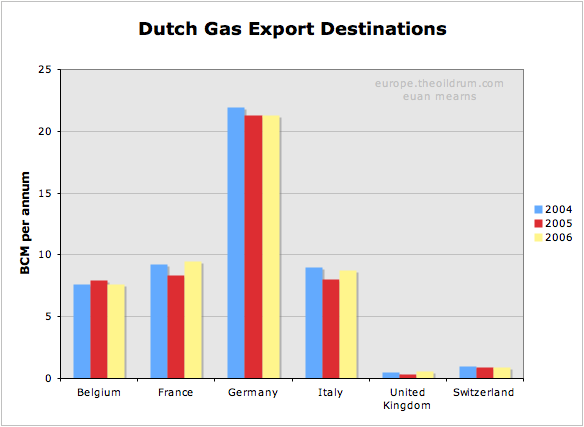 Figure 8 Destinations of Dutch gas exports. Note that the Dutch import gas from Russia and Norway for re-export. It can be seen that Dutch gas exports have been declining irregularly since the late 1970s and that some day post 2020, the Dutch may become an importer of natural gas. Norway Norwegian gas production has expanded rapidly in recent years, mainly the result of the Troll Field development. This expansion is set to go on for another couple of years, but then I suspect the expansionary phase will come to a halt. In 2006 Norway produced 87.6 BCM of gas. Since then the Langeled pipeline that connects the Ormen Lange Field to Easington in England (and also to continental Europe) has been completed. The capacity of Langeled is about 20 BCM per annum. Furthermore, the development of the Snřhvit Field in North Norway with an LNG train provides Norway with an additional 5.7 BCM capacity. The Norwegian export pipeline system is reported to have a capacity of 120 BCM per annum. With domestic consumption running at 4.5 BCM and LNG production at 5.7 BCM, future Norwegian production is forecast to run at 130 BCM per annum. With Europe becoming ever more thirsty for gas, there was a plan to expand production in the Troll Field by 20 BCM per annum. Most significantly, this consent was refused by the Norwegian parliament. Hence Norway is in a position of having ample reserves to sustain a short term production boost, but instead seems to be choosing the path of restrained production which will favour an extended plateau at lower than maximum possible production levels. 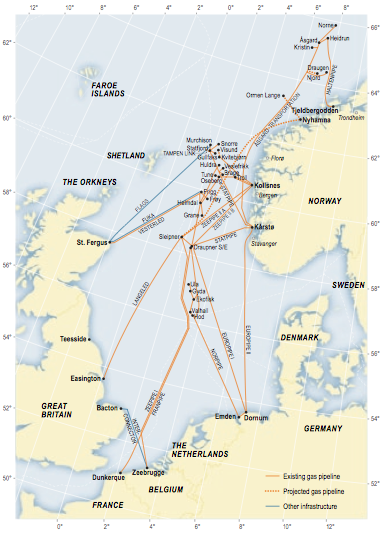 Figure 9 Norwegian gas infrastructure. The map of the Norwegian gas pipeline export system shows where Norwegian gas enters the UK and Continental Europe. The UK imported gas from Norway during the 1970s and 1980s where gas from the Frigg Field was piped to Scotland via the Vesterled pipeline. Since then the UK has had no need for Norwegian gas - until recently where a massive expansion of import capacity has been built. The Vesterled pipeline is now connected to the Norwegian gas transmission network and has been one route into the UK for Norwegian gas in recent years. There are, however, two new pipeline systems. The already mentioned Langeled pipeline that connects the UK to Ormen Lange via the Sleipner hub. And the Tampen Link that connects Statfjord and other mature fields in the Tampen Spur area to the UK operated FLAGS pipeline system. FLAGS transports associated gas from the northern UK fields to St Fergus in Scotland and since that UK gas production is now in decline, the Tampen Link will fill that surplus capacity - for a while at least. Five other pipelines make landfall in continental Europe at 4 import terminals. Three pipelines feed two terminals in North Germany. And one pipeline lands at Zeebrugge in Belgium and one at Dunkirk in France. These entry points are connected to a broader European gas transmission system which pipes Norwegian gas as far as Spain, Austria, the Czech Republic and Poland. 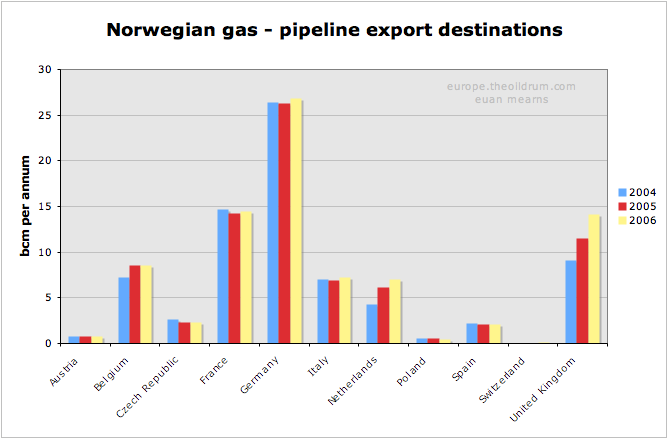 Figure 10 Export destinations for Norwegian gas. Up until 2006, all Norwegian exports were via pipelines to Europe. In 2007, Norway opened its first LNG train and it will be interesting to see where these LNG exports end up. It can be seen that Germany is by far the largest importer of Norwegian gas, followed by France, Belgium, the UK and Italy. One curiosity in this data is that the Netherlands are shown as a net importer of Norwegian gas. I can but speculate that The Netherlands are importing Norwegian gas to meet export contracts whilst conserving their own gas reserves. Demand and import patterns Natural gas consumption within OECD Europe has grown on average at 2.6% per annum since 1980. Back in 1965, Europe consumed less than 25 BCM per annum and this grew to over 470 BCM per annum by 2005, fuelled by North Sea gas. Higher prices and shortage of Russian supply saw consumption fall in 2006. 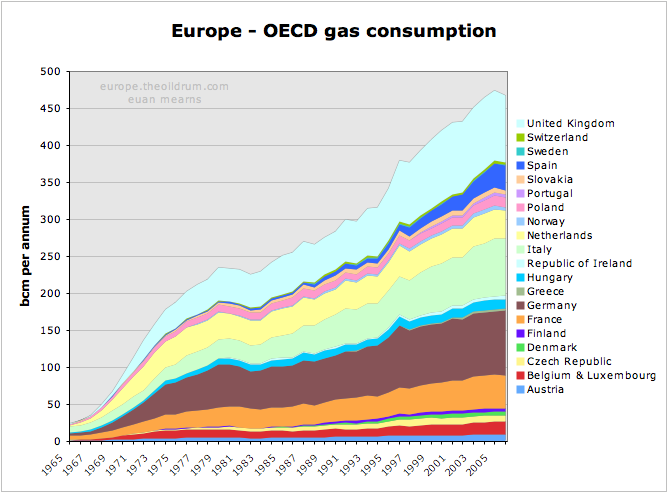 Figure 11 Forty years of gas binge in OECD Europe. Where next for European Natural gas demand? Will the past trend continue, or will high price curtail demand? This is impossible to answer, but there are a number political, demographic and resource factors consistent with demand continuing to grow unchecked.
If demand for natural gas continues to grow then source of supply and the security of that source is highly relevant. The following section shows the main sources of supply for Europe's main consumers (excluding the UK). One thing all gas import strategies have in common is diversity of supply. Germany Germany has some significant and stable indigenous gas production, but is heavily dependent upon The Netherlands, Norway and Russia for pipeline imports. With Dutch gas production in decline, Germany will presumably be looking to increase supplies from elsewhere. The cornerstone of the German strategy is the Baltic pipeline that will assure supplies of Russian gas direct to Germany that will by-pass former Soviet republics and East European states. Without LNG, the German strategy seems constrained, since falling UK and Dutch production will place greater demand on Norwegian and Russian gas from several other states. 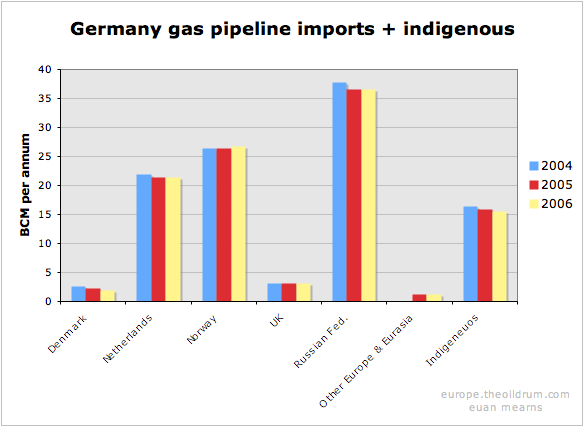 Figure 12 The import sources of gas to Germany. France France is unique among major European gas consumers with no indigenous gas production. France produces no oil and only a little coal - hence their reliance upon nuclear energy for power generation. Like Germany, France relies heavily upon Dutch, Norwegian and Russian gas pipeline imports. France also has a mature LNG import trade with significant imports from north and west Africa. 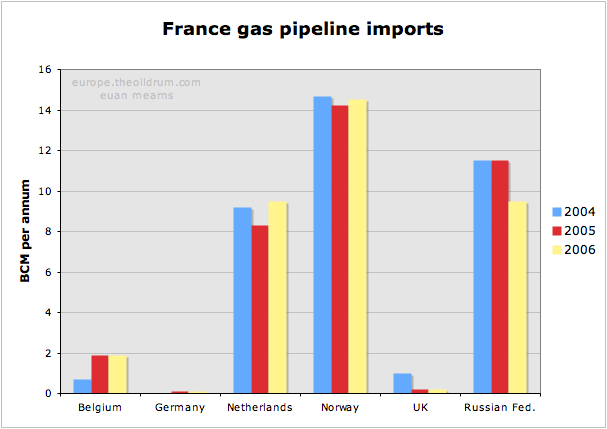 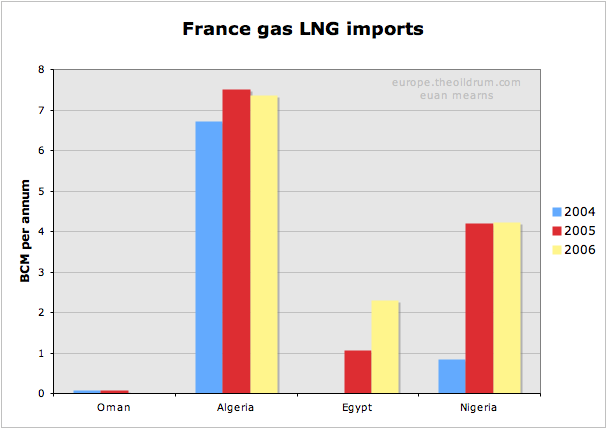 Figures 13 & 14 The import sources of gas to France. Italy Italy has significant but falling indigenous gas production. It also has a highly diversified gas importation infrastructure born in part from its geographic location. Italy imports gas from Norway, The Netherlands and Russia but is also linked to Algeria and more recently Libya by pipeline. Italy also imports small amounts of LNG, mainly from Algeria. Note how there were significant imports from Nigeria in 2004 - but then nothing. It seems these cargoes may have switched to France in 2005 / 06. 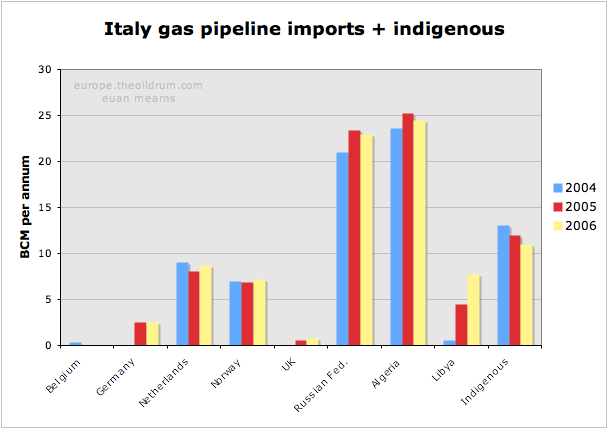 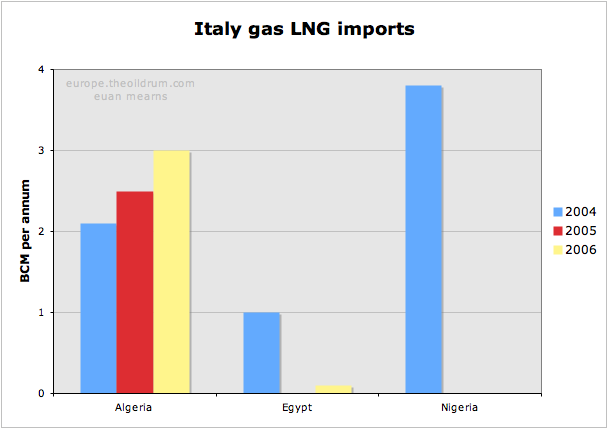 Figures 15 & 16 The import sources of gas to Italy. Current and future sources of supply The chart shows that Russia and Algeria are by far the most important sources of imported gas to OECD Europe. This raises the questions of whether or not these countries will be able to maintain or increase future supplies and if not, where will Europe's growing thirst for gas be met in the future? 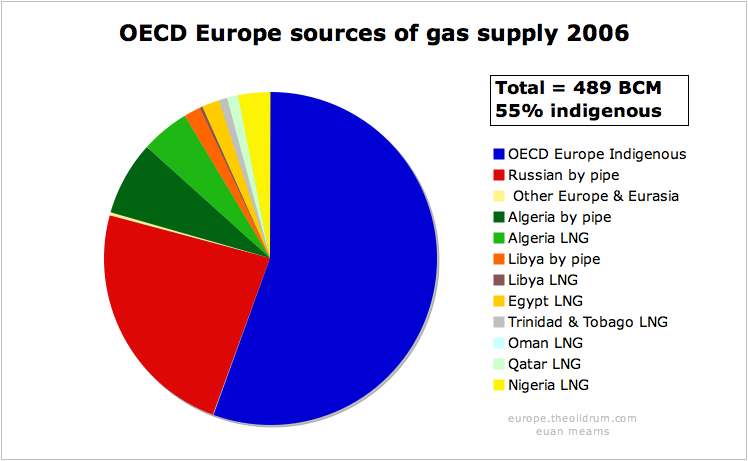 Figure 17 Sources of gas in OECD Europe in 2006. Russia Russian gas production had an interim peak in 1991, and with the fall of the Soviet Union went into decline for a number of years. Since 1997, production has begun to rise again and a new high was reached in 2006 of over 600 BCM per annum. The $60K question is where next for Russian gas production? This question is just as important as the future direction of Saudi oil production. 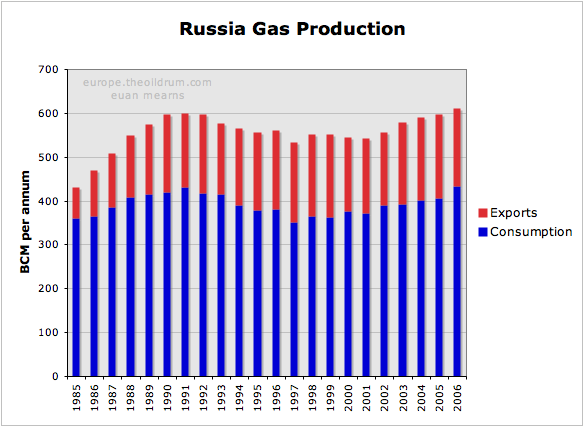
Figure 18 Russian gas production, consumption and exports. 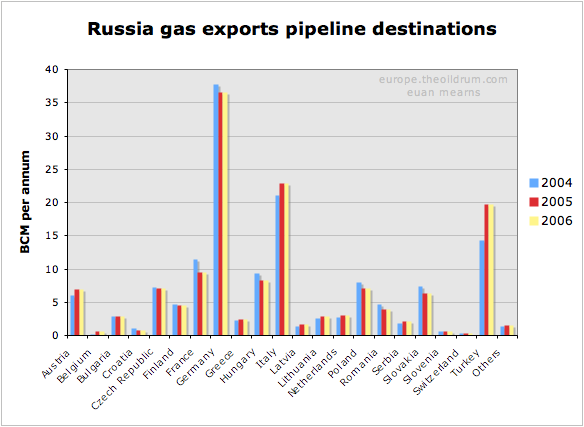 Figure 19 Destinations of Russian gas exports Russia exports less than one third of its gas production. The majority of exports are to OECD Europe, though a significant amount still goes to former republics. But the amount going to Ukraine, Belarus and Moldova is not documented in the BP statistics, and is presumably included with Russian consumption data. The structure of Russian gas production makes exports vulnerable to any down turn in production and / or increase in domestic consumption. Russian gas exports have been essentially static since 1990, and with the largest fields in decline (see below) it seems unlikely that Russia could at this stage raise production to meet the rising import requirements of OECD Europe.  Figure 20 Map showing the west Siberian gas fields of Russia. The three giant fields of Yamburg, Urengoy and Medvezhye have historically provided the bulk of Russia's gas. All three are now in decline (see below). Much of Russia's remaining potential lies in this area, particularly on the Yamal peninsula, to the left of the circle. The map is borrowed from a presentation by Kjell Aleklett. 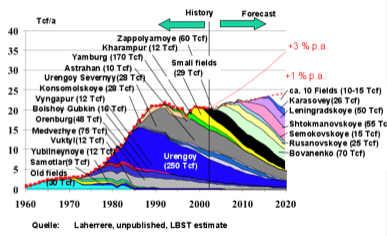 Figure 21 Russian gas production forecast by Jean Laherrere showing how second tier fields may compensate for decline in the three giants - Yamburg, Urengoy and Medvezhye. Historically, more than 50% of Russian gas production has come from 3 giant fields - Urengoy, Yamburg and Medvezhye. This excellent chart (unpublished) from Laherrere shows that all three of these core producers are in decline. Since Russia has relied upon these three supergiants for core production they now have an inventory of second tier giant fields to develop that may compensate for the decline from The Big 3, as shown on Laherrere's chart. The challenges for Gazprom are immense. Bovanenko lies on the Yamal peninsula below permafrost. It is at the end of proposed piplelines shown as dashed red lines on the map above. Shtockman lies out of helicopter range in the Barents Sea. Recent reports suggest that the Russians want to use a floating nuclear reactor to power the production platform. 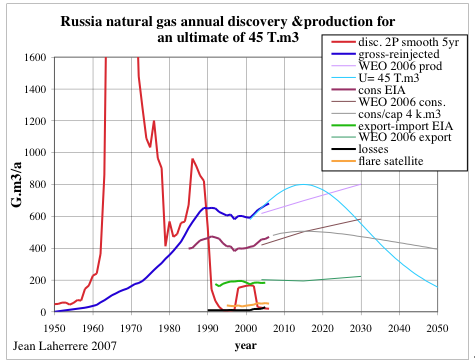 Figure 22 Russian gas production scenarios by Jean Laherrere. WEO forecasts show rising consumption matching rising production with flat exports of around 200 BCM per annum. This new chart from Laherrere 2007 shows a peak in Russian gas production about 8 years from now with unconstrained production which is unlikely to happen. Instead, constrained production as indicated by the slowly rising WEO 2006 forecast matched by rising consumption will give rise to relatively flat gas exports forward to 2020. So it seems likely that Russia will be able to maintain gas exports but will unlikely be able to increase exports to compensate for falling OECD Europe production. A critical geo-political question, however, is how these exports are distributed in future? The Sakahlin projects will see East Siberian gas entering the Asian markets for the first time. Furthermore, the Baltic Gas Pipeline will witness a new prioritisation of gas energy security in Germany and western Europe. The Baltic Gas Pipeline, which is under construction under a joint venture between Gazprom and German companies BASF and E.ON, will deliver 27.5 BCM per annum direct to Germany in the first instance with the option to rise to 55 BCM. All of OECD Europe's gas from Russia currently has to cross The Ukraine and then either Slovakia or Poland in order to reach the main destinations of Germany, Italy and France. As we saw in the winter of 2005 / 6, Russia struggled to meet all commitments given extreme cold weather at home and cut gas supplies to some unfavoured former Soviet enclaves. The spat with Ukraine at that time highlighted how dependent OECD Europe was on the goodwill of the Ukrainians and the Baltic Pipeline circumvents that problem, providing gas security to Germany at least. 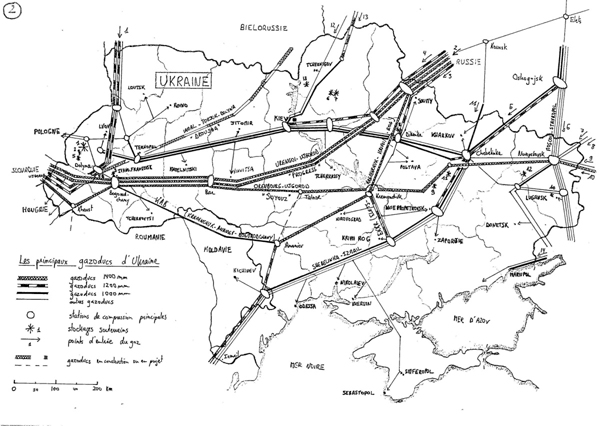 Figure 23 Map of pipelines in Ukraine that carry Russian gas to western Europe via Poland and Slovakia. From Ukraine vs Russia: Tales of pipelines and dependence by Jerome a Paris The Baltic pipeline will be fed primarly by gas from a new field. The Yuzhno-Russkoye field, which recently started production, is located in the same area as Urengoy, is included in Laherrere's chart and is one of the new fields that will offset decline from The Big 3. This new export capacity, therefore, does not necessarily represent new productive capacity but merely a more secure route for Russian gas into the OECD. OECD Europe currently receives 115 BCM per annum from Russia, so the Baltic pipeline may eventually secure almost half of those deliveries. However, should OECD Europe face gas shortages, it is those countries at the end of the pipeline that will still be most vulnerable. Some interesting negotiations may lie ahead. In summary, it is exceedingly difficult to predict how reliable Russian gas exports to OECD Europe will be in future. It seems most likely that Russia will maintain current production levels of 600 BCM per annum until 2020. However, increasing domestic consumption, and exports to East Asia may see gas exports to the west declining. Germany will be in the strongest position to secure supplies. If the remaining supplies are rationed by ability to pay then some of the poorer eastern European states may suffer. Algeria 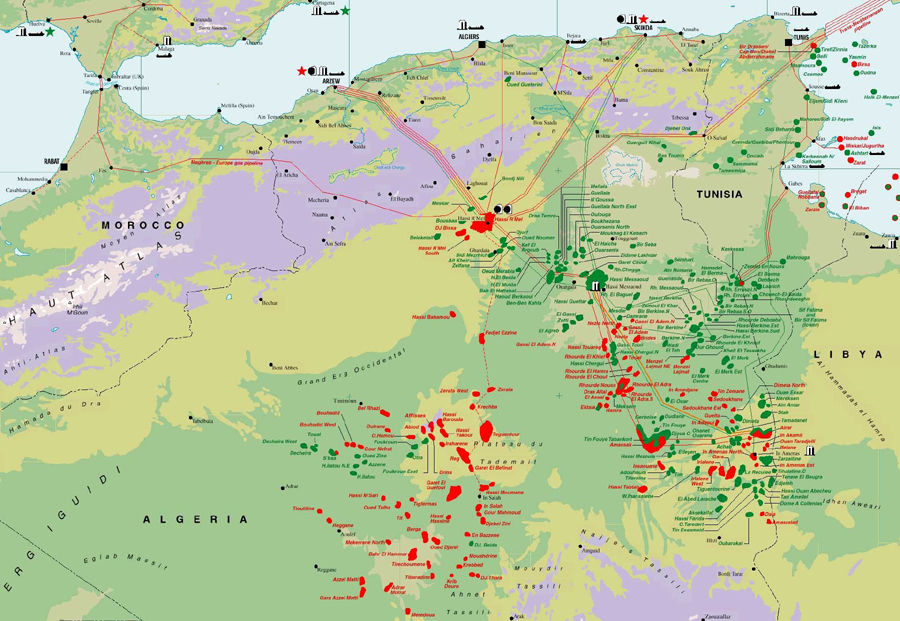 Figure 24 Map of oil and gas infrastructure in Algeria. Europe is fortunate to have gas rich North Africa lying off its southern shores. According to the BP Statistical Review, Algeria has 4.5 TCM remaining gas reserves placing it number 8 in the world. Accordng to the analysis of Jean Laherrere, Algeria has 4TCM gas reserves remaining, which is in fair agreement with the BP figure. It is fortunate for Europe that Algeria lies close to the southern border of the continent allowing Algerian gas to be piped into Italy and Spain. There is also a significant trade in LNG between Algeria and Europe. 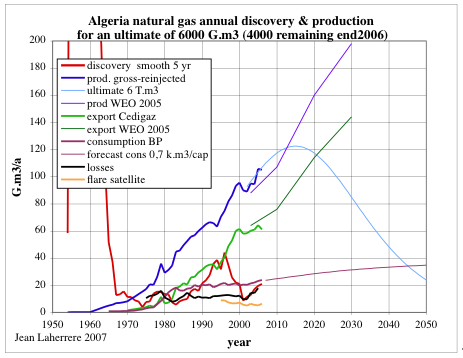 Figure 25 Discovery and production gas models for Algeria by Jean Laherrere. Laherrere provides a more detailed picture of gas production than can be compiled from the BP data. The main difference is production reported gross of re-injected gas. An unconstrained production peak some 17 BCM per annum higher than today's production is shown around 2015. 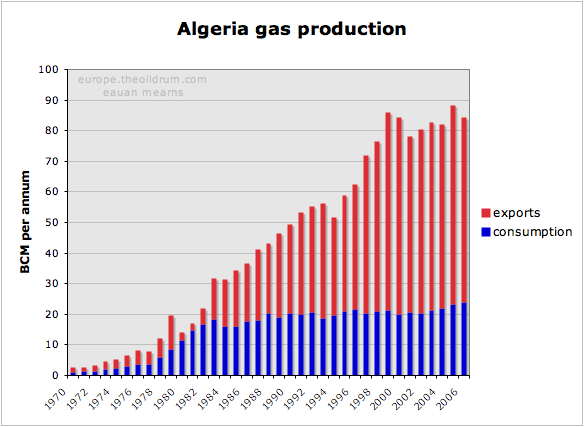 Figure 26 Algeria gas production, consumption and exports. Production and exports have not risen since 1999. Algerian production grew steadily until 1999 but has since stagnated. There was a new discovery cycle during the 1990s and it is this that may provide impetus for some new production growth. Algerian consumptin is growing slowly and this will consume a portion of new production. New gas export capacity is estimated roughly to be 12 BCM per annum by 2012. 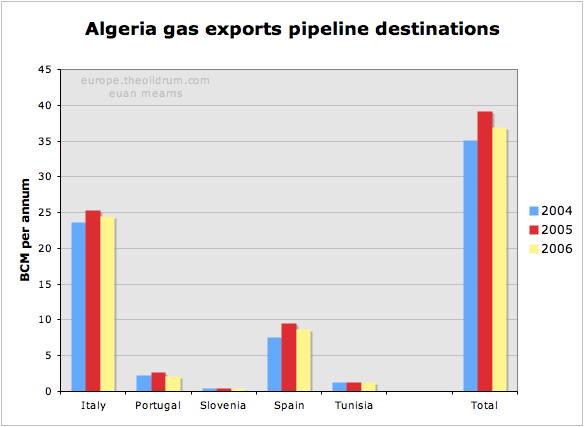 Figure 27 Destinations for Algerian pipeline gas exports. Algeria exports about 37 BCM per annum by pipeline but is also active in LNG production with LNG exports of 25BCM in 2006. Most of the LNG was exported to Europe (and Turkey) with only small quantities going further afield. Europe is a short trip for an LNG tanker from North Africa, and in terms of tanker utilisation I suspect it will continue to be more profitable to deliver N African LNG to Europe than further afield. 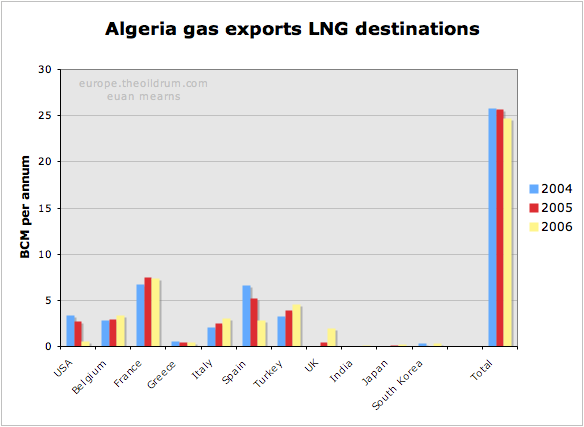 Figure 28 Destinations for Algerian LNG gas exports. The IEA 2005 energy outlook had this to say: Algeria is the third-largest exporter of natural gas in the world. Exports are expected to increase as pipeline and LNG projects are brought on line. Gas exports were 64 bcm in 2003 and are expected to climb to 76 bcm in 2010 and reach 144 bcm by 2030. The IEA target for 2010 looks marginally optimistic and their target for 2030 is a reserves busting feat as indicated on Laherrere's chart (Figure 25). Libya and Egypt Both Libya and Egypt have seen rapid expansion of their gas production and exports in recent years. This is set to continue at a slower pace for a number of years according to these forecast models from Jean Laherrere. Growing population and domestic gas consumption in Egypt looks set to outstrip production growth and Egypt may cease to be a gas exporter beyond 2025. 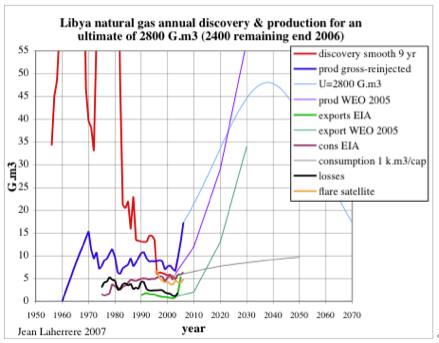 Figure 29 Gas discovery and production models for Libya by Jean Laherrere. 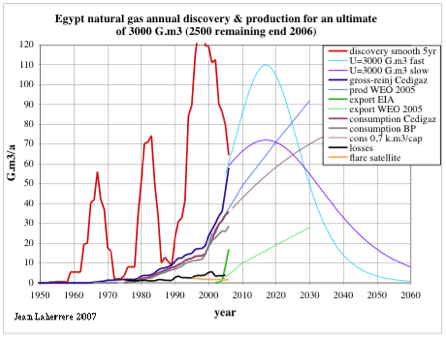 Figure 30 Gas discovery and production models for Egypt by Jean Laherrere. In the export model (Figure 31) I have used the "slow" production model for Egypt. Combining the three production models of Laherrere from Algeria, Egypt and Libya provides this picture of gas exports from N Africa peaking at around 120 BCM per annum in 2015. That represents a 33 BCM per annum growth from current export levels. 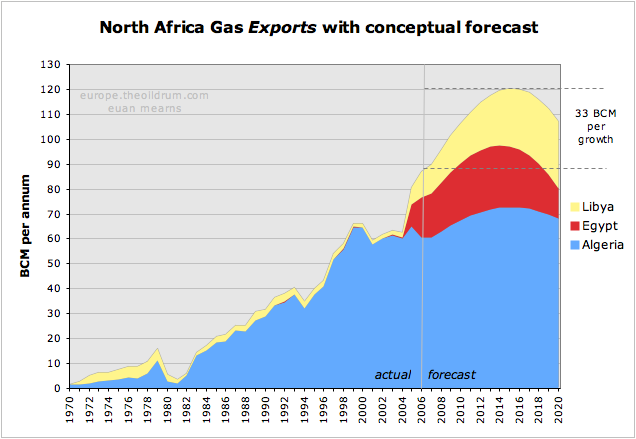 Figure 31 Gas export model for N Africa showing expansion of production and exports in the years ahead but with a conceptual export peak around 2015. OECD Europe gas security With OECD Europe indigenous gas production set to decline and good reasons for believing that demand for natural gas will continue to expand in the future, OECD Europe faces the prospect of importing ever larger amounts of gas (LNG) from ever more remote parts of the world. Current imports are running at 197 BCM per annum and the BAU scenario shown below shows imports burgeoning to 442 BCM by 2020. Where will this additional 245 BCM come from? 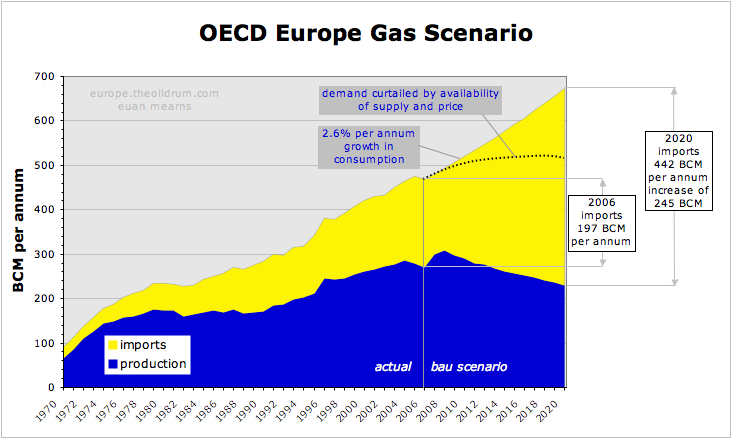
Figure 32 Gas scenarios for OECD Europe summarising the indigenous supply forecasts and demand forecasts from the preceding sections. With the BAU demand scenario, imports will need to grow from current 197 BCM per annum to projected 442 BCM per annum by 2020 - an increase of 245 BCM per annum. It is doubtful that this quantity of gas may be sourced from African and Middle East markets. It is therefore considered more likely that high price and supply shortages will curtail demand for gas. It is conceivable that conservation, more efficient energy use and substitution with alternative sources of electricity may fill the gap left by declining gas supplies. This is near impossible to answer with certainty. My feeling is that Russia will strive to meet current commitments which will result in their gas exports neither increasing nor decreasing in the 2020 time frame. N Africa will see strong growth in production that will be offset by strong growth in their domestic consumption. Up to 33 BCM of new supply may come from N Africa and it seems reasonable to assume that the majority of that gas will come to Europe. That leaves 212 BCM to source from else where and will inevitably entail a massive expansion of LNG export and import infrastructure beyond that which already exists. In the period 2010 to 2020 Europe will face fierce competition for LNG supplies from the mature markets of Japan, South Korea and Taiwan and growing competition from new markets for LNG in the USA and most likely also in China. In 2006, the total global LNG trade was 211 BCM and so we are talking about doubling that by 2020 to satisfy OECD European needs alone. The main sources of new supply will be West Africa (Nigeria), Qatar and Iran. Since Qatar has declared a moratorium on new LNG projects forward to 2011 it is a major challenge for these three countries alone to meet global demand growth. 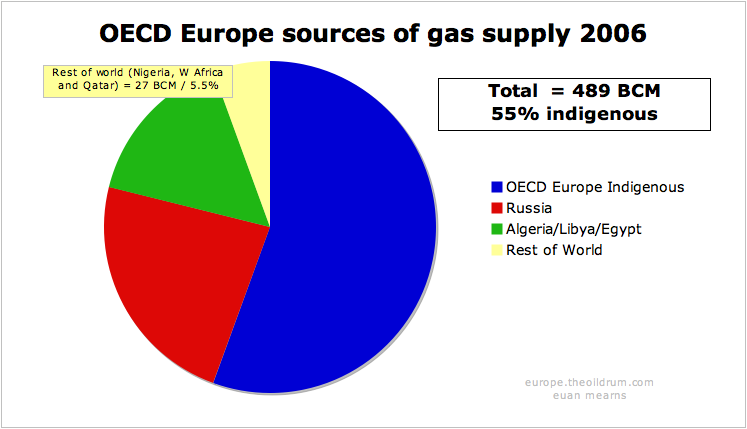 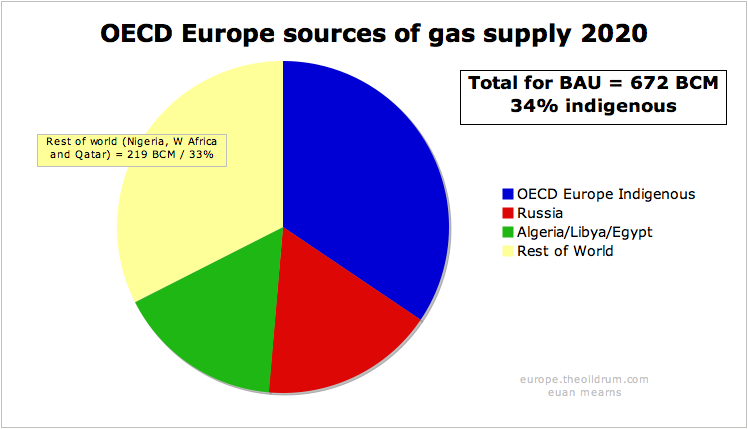
Figures 33 & 34 The changing face of gas security in OECD Europe. With a BAU demand scenario, OECD Europe will face importing ever growing quantities of LNG from remote sources around the globe. The crux of this whole issue is how growing demand for gas is managed. The UK, and other OECD governments seem intent on allowing market forces to determine the outcome. I would be the first to admit that the dynamics of supply and demand in the European gas trade has so many dimensions that trying to regulate and plan this trade is not simple. But on the other hand, allowing market forces, national economic strength, and price to determine who gets and who doesn't get the available energy may have disasterous and unforeseen outcomes. A scenario where the former Soviet Republics and then the east European states and perhaps Turkey are left in the cold whilst western Europe uses historic strengths to secure itself energy supplies may have unpleasant outcomes flowing from a newly destabilised former Soviet bloc. Energy poverty throughout the poorer parts of Western Europe may also have undesirable consequences for the warm middle and upper classes. The main message of this post, therefore, is to call upon the politicians of the OECD in Europe to show some rare leadership, and to recognise that massive energy conservation, and expansion of sensible alternative energy schemes, offer a better alternative to the polarisation that is likely to result from allowing market forces to determine the outcome of energy decline. Acknowledgement:I am indebted to Jean Laherrere who upon my request sent his most recent work on gas resources in countries relevant to the European market. Many of the charts come from a paper titled "Etat des reserves de gaz des pays exportateurs vers l’Europe" presented at Club de Nice Energie et geopolitique 29 nov. - 1er dec. 2007.Euan Mearns December 13, 2007 www.theoildrum.com/user/Euan+Mearns |
| Home :: Archives :: Contact |
WEDNESDAY EDITION July 15th, 2026 © 2026 321energy.com |
|