|
TUESDAY EDITION June 9th, 2026 |
|
Home :: Archives :: Contact |
|
|
The Gas Storage CyclePeter McKenzie-BrownEmail: pmbcomm@hotmail.com languageinstinct.blogspot.com April 8, 2008 
Chart #1: This chart compares the amount of natural gas in storage (usually underground reservoirs) in the lower 48 states. The shaded area indicates the range between the historical minimum and maximum values for the weekly series from 2003 through 2007. The pattern is normal, of course. Like squirrels with their nuts, we store natural gas when it’s plentiful and consume it when we need it most. Last fall, the amount of natural gas in storage in the United States set a new five-year record. Since then it has plummeted, and it has dropped more dramatically than at any other time in the last 15 years. The severity of the drop is obscured by the impact of Hurricane Katrina, which distorted the cycle several years ago. As my correspondent Paul Stallion explains, looking at the numbers you will notice that this winter approximately 30 per cent more natural gas was drawn down from storage than for any other year in the past decade and a half. This fact is somewhat hidden in the chart of seasonal highs and lows, because usage nevertheless stayed within the 5-year average. What isn't mentioned is that the short-term (5-year) average itself is skewed by the hurricane which devastated New Orleans (which is also the reason gas in storage in the last few years could so easily remain so close to the top of that average). Chart #1 is therefore misleading, in terms of how dramatic the recent drawdown has been - which is why no one has yet mentioned it...The chart also illustrates a key trend. Over three winters, there have been progressively lower supplies as the winter ended. This post suggests that this year less gas in storage is likely to combine with other factors to drive natural gas prices much, much higher than you might expect. The volumes of gas in storage vary every year. During warm winters we consume less, for example, and during cold winters, more. Sometimes gas production surges, as it has in the south-central United States (Texas, Oklahoma, Louisiana and Arkansas) for the last few years. The combination of warmer winters in ‘06 and ‘07 plus growing supplies help explain the high storage levels of the last few years. The relatively mild summers of the last few years have been another factor. When it’s really hot, you use a lot of gas to generate electricity for air conditioning. Also, last summer liquefied natural gas (LNG) from overseas was cheap, and the US brought in large volumes by the tanker load for storage. In the last six months, that situation has reversed. This winter was unusually cold in eastern North America, so we have consumed a lot more gas than usual. Also, prices for LNG are now much higher in Europe and East Asia than in the US, so that supply is going elsewhere: US imports have dropped from 4 billion cubic feet (BCF) per day last July to less than half a BCF today. And while the surge in south-central gas supply continues - mostly in Texas - production is in decline everywhere else in North America except Alaska, which isn't connected to any serious markets. Now, turn your mind to the following chart. In my view, it says important things about the state of natural gas. 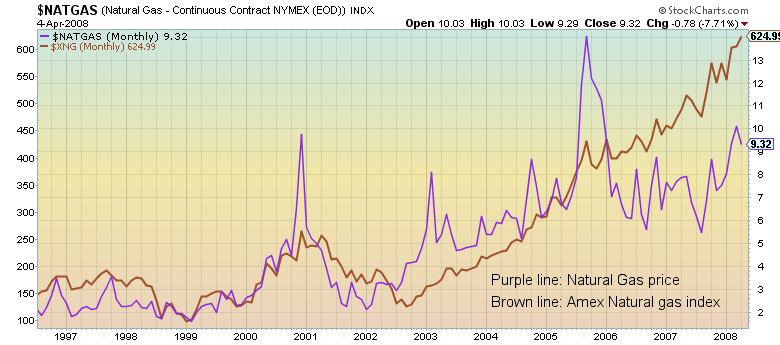 Chart #2: The purple line shows NYMEX natural gas prices during the last decade; the brown line shows the performance of the natural gas index (XNG) on the Amex. The XNG is a share price index of the 15 largest players in the US gas business.In the first half of the last decade, gas prices averaged perhaps $3.50 per thousand cubic feet. In the last five years, they have been around $7. A big increase, but compared to the price of oil, which has risen by a factor of five, not a big deal. The odd part about chart #2 begins in the winter of 2002. Since that time natural gas prices have had lots of peaks and valleys, but the XNG has climbed steadily. My friend Carlo Magnifico, who provided this chart, puts it like this: There’s been a steady accumulation of gas shares since 2002. The gas index has not had any really painful corrections like the price of gas has. It’s as though the price of gas doesn’t really factor into the price of gas stocks. Someone knows something. Gassy stocks are the place to be.Last December this column anticipated the recent run-up in natural gas prices, and the balance of this article supports that call. We are now in a commodity bull market. During those cycles, commodity stocks rise while industrial stocks drop. In another article, I called this the great divergence. Before I summarize the case for natural gas prices continuing to rise, a comment on one likely cause of this commodity bull. Harvard economics professor Jeffrey Frankel suggested in his blog that a decrease in real interest rates (“real” rates exclude inflation) increases the demand for storable commodities. In his thought-provoking comment, he writes, If strong economic growth is not the explanation for the large increases since 2001 in prices of virtually all mineral and agricultural commodities, then what is? One wouldn’t want to try to reduce commodity markets to a single factor, nor to claim proof of any theory by a single data point. Nevertheless, the developments of the last six months provided added support for a theory I have long favored: real interest rates are an important determinant of real commodity prices. High interest rates reduce the demand for storable commodities, or increase the supply, through a variety of channels:Professor Frankel makes clear that this is only one factor, but I think it's a point worth noting. Keeping that idea in mind, here is the case for a continuing bull market in natural gas prices. Such a market is probably the event that the steady upward performance of the XNG (Chart #2) is anticipating. • We are in a bull market for commodities (partly for the reasons Frankel suggested), and a rising tide raises all ships. • The gas industry must put enough gas in storage to meet demand next year, and the gas needed will be much greater than it was a year ago. As Chart #1 shows, volumes in storage are now well below last year’s volume, so demand will be much stronger. More to the point, this spreadsheet shows that this winter 30 per cent more natural gas was drawn down from storage than for any other year in the past decade and a half. As Paul Stallion's comments explained earlier, Hurricane Katrina's impact on supply obscures this statistic because it so dramatically dropped the bottom end of the 5-year average. • Gas production has been increasing in the south-central US. However, it is in decline elsewhere in the lower 48 states. Also, imports from Canada are unlikely ever to rise to the peak levels of a few years ago - partly because of declining production, but also because of greater domestic demand in Alberta and elsewhere. • Prices for LNG have more than doubled since last summer. Some countries are willing to pay $20 per thousand cubic feet, compared to less than $10, which is what Americans now pay. This helps to illustrate that the gas industry is going through a period of rapid globalization. It also means we are far less likely to see low-cost LNG unloaded at American gasification terminals. Cargoes will continue to be redirected to higher price destinations, like East Asia. • The last factor to consider is the weather - to a large extent an imponderable, but something meteorologists are getting better at forecasting. The US National Weather Service predicts a hotter-than-normal summer this year. That should mean higher demand for air conditioning, and therefore greater demand for natural gas. On a related note, the usually accurate Colorado State University forecast team "expects an above-average Atlantic hurricane season and may raise its prediction of 13 tropical storms and seven hurricanes when it updates its outlook" this week, according to Reuters. Either of these factors could have an additional big impact on gas supply. High temperatures mean more need for air conditioning, and therefore more gas demand to fuel electrical generation. Hurricanes could mean shut-in production in the Gulf and in Texas and Louisiana. Forecasting prices is a mug's game, and I will stay out of that. But I nonetheless anticipate a considerable increase in natural gas prices from where we are today. To protect myself against that, I have put a little money here. Peter McKenzie-Brown Email: pmbcomm@hotmail.com languageinstinct.blogspot.com April 8, 2008 |
| Home :: Archives :: Contact |
TUESDAY EDITION June 9th, 2026 © 2026 321energy.com |
|