|
TUESDAY EDITION June 9th, 2026 |
|
Home :: Archives :: Contact |
|
|
Colin Campbell and the Crack of DoomPeter McKenzie-BrownEmail: pmbcomm@hotmail.com languageinstinct.blogspot.com April 1, 2008 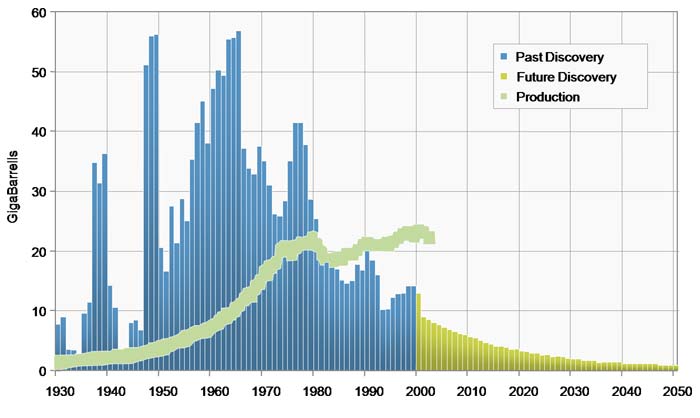
For many peak oil believers, this is the scariest chart you can imagine. The blue lines show historical oil discoveries. The gold lines project discoveries into the future. The line that looks like a rising serpent shows annual production up to about 2005. The chart was created by peak oil guru Colin Campbell in 2004 for a deliciously ironic article titled "The Heart of the Matter". The chart looks like a road map to the Crack of Doom, and it has been quite influential. In this column I have frequently provided arguments in favour of peak oil theory, and I am an unabashed admirer of Campbell and his work. However, I believe this chart, though directionally accurate, is simplistic and alarmist. It needs to be nuanced. We can do that in three ways. • First, note that the blue lines essentially track the world’s new-field discoveries of light and medium oil. The chart suggests that these volumes are the world’s oil reserves. It doesn’t nearly reflect the reserves additions that come through infill drilling, enhanced oil recovery and other standard oilfield practices. By applying simple math to the chart (subtracting production from discoveries), you will come up with world oil reserves far short of the roughly 1.2 trillion barrels that the Energy Information Agency and other authorities have booked. As they are developed, most discoveries prove to be much bigger than the estimates at time of discovery. This is partly because reserves are a function of economics. When you find a new field you calculate its reserves based on present conditions and price forecasts – say, in 1970, $2.50 per barrel into the foreseeable future. As prices rise relative to costs, you will get more oil out of that field – of that you can be sure. The thinking by which M. King Hubbert forecast the year of peak oil production in the United States was incredibly successful. What is rarely discussed, though, is that Hubbert underestimated by about 50 per cent the amount of oil that would be available in the US after it reached the peak. To a large extent this was because new reserves became available through changing technologies and more favourable petroleum economics. • Second, give heavy oil, bitumen and oil shale the credit they deserve. Because of the nature of the beast, these unconventional resources are not booked as reserves until they become economically and technically producible. Alberta’s huge oil sands are a classic example. In 2005 America’s Energy Information Agency booked Canadian oil reserves as second in the world (after Saudi Arabia) because of the impact of higher prices and improved technologies on the oil sands. If that amount of oil – 174 billion barrels (174 gigabarrels) – were added to the gold-coloured reserves lines on Campbell’s chart, it would require a line that would tower over the rest of the chart by a factor of three. Campbell’s methodology does not account for this kind of event. And in all likelihood, much more of the oilsands will eventually be booked as reserves. 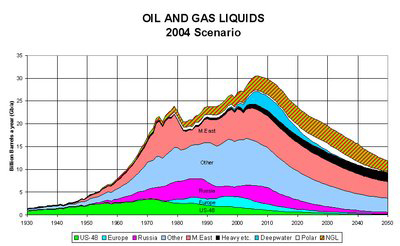 That point takes me to this chart , which is also from Campbell’s article. The black wedge – characterized as “Heavy, etc.” in the legend – is his estimate of the contribution of heavy oil to the global energy liquids picture. Eyeballing suggests that he expected these unconventional resources to be about 4.5 million barrels per day by now, world-wide. Heavy oil, synthetic oil and non-upgraded bitumen represent about two million barrels of production per day in Canada alone, and Venezuela and Mexico are also big producers. What’s more, Canada’s oil industry is working hard to develop export markets for heavy oil, because there is a great deal more production yet to develop. Indeed, Canadian producers are selling their heavy oil at a discount because they cannot get it to world markets. According to one excellent and credible report, seven years from now Alberta alone will be producing about three million barrels per day of “Heavy, etc.” That estimate risks production for economic and environmental obstacles, so it is probably low. • Third – and this is my main point – let’s acknowledge that the serpent-like production line in Campbell’s chart, while it is not a happy sign, is not the spectre of doom it appears. The world’s unconventional resources will greatly blunt the blow – relative to the steep declines described in Campbell’s chart, in any event. One amazing feature of the oil sands is their incredible energy density. Imperial Oil’s Cold Lake bitumen plant, for example, is a tiny dot on the map of Alberta, yet it produces 6 per cent of Canada’s oil. The resource density of these unconventional resources is immense, and that density is what makes it such an important resource. The world is heading toward capital-intensive, technology-intensive, pollution-intensive and energy-intensive energy - bitumen from Cold Lake, for example. The greater the capital intensity, though, the lower the geopolitical risk must be. Keep that in mind when you consider development prospects for Venezuela’s Orinoco heavy oil belt, which is so huge it rivals the resources of Canada. The geopolitical risks in that country are enormous, so the likelihood is small that new Venezuelan supplies will soon hit world markets. Strongman Hugo Chavez is increasingly unpopular in his own country, however, and the economy is in disarray. Oil production is in decline even though the the country has the largest conventional reserves in this hemisphere. Given that situation, it is possible to imagine a post-Chavez Venezuela which will develop those resources and become a resurgent supplier to the world. If that happened, it would lead to another super spike in booked reserves. I share the view that a global Hubbert’s peak is nigh. The world is facing serious energy supply problems, and they are related to peak oil. To too great a degree, however, the discussion has failed to recognize the immensity and importance of the world’s unconventional sources of oil. Those vital resources will radically change the shape of the chart as they are plotted into it. Peter McKenzie-Brown Email: pmbcomm@hotmail.com languageinstinct.blogspot.com April 1, 2008 |
| Home :: Archives :: Contact |
TUESDAY EDITION June 9th, 2026 © 2026 321energy.com |
|