|
MONDAY EDITION July 21st, 2025 |
|
Home :: Archives :: Contact |
|
|
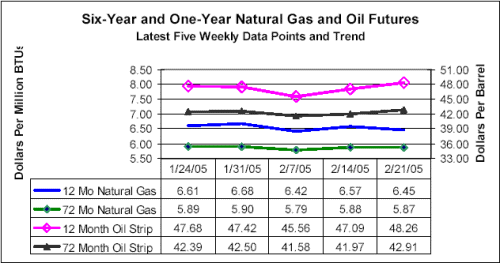
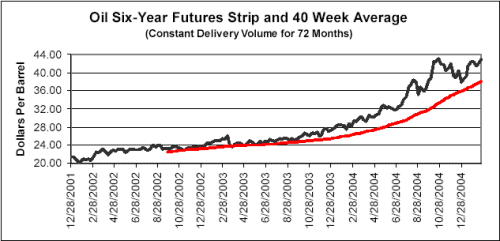
Meter ReaderA Weekly Analysis of Energy Stocks Using the McDep RatioMcDep Energy Investment Research by Kurt Wulff February 28, 2005 Summary and Recommendation As more investors seem interested in buy-rated energy stocks, we reconsider the potential worries. World growth may stop, a large new supply of cheap, clean energy may be discovered, the dollar may become good as gold, inflation may end, environmental controls may end or the world may send more troops to the Middle East. Those worries, deliberately overstated by us, touch on the major economic, monetary, environmental and security factors that influence the outlook for energy investment. Weighing the positives and negatives every day in the futures market, commodity investors conclude increasingly that the average price of oil for the next six years will be higher than previously expected. Similarly we expect stock market investors to conclude increasingly that stock prices for recommended natural gas and oil producers should be higher than previously quoted. Demand and Supply at Sharp Price Inflection Energy demand and economic growth are linked. ExxonMobil Downstream Chief Edward Galante last week contrasted more rapid growth in developing countries with slower growth in developed countries. We believe in economic growth for billions of hard-working people who want a better life. On the supply side, the world has reached the daily limits of conventional light, sweet oil production. There are vast quantities of stranded natural gas overseas to be liquefied, and oil sands to be refined in Canada as well as in Venezuela. With sufficient money, time and security, supply can be expanded. Oil Possibly Better Than Money The twin deficits, fiscal and trade, point to more dollar devaluation. Yet foreign central banks apparently support the currency by holding U.S. Treasury debt. Perhaps a better investment for those countries might be in oil and gas supply since the same countries that hold the largest amount of dollars are dependent upon energy imports. Maybe low long-term interest rates are pointing to a world recession instead of simply being driven down by central bank reserves. In that event, oil and gas producers may not suffer as much as the economy in general because energy is still a vital commodity that we need every day. Moreover, the producers we recommend have little or no debt to leverage stock price downward and threaten financial failure in a recession. Environmental Tradeoffs May Stimulate Economic Activity We believe every person should be able to use as much energy as he or she can afford subject to doing no unacceptable damage to the environment. The stricter we are in applying environmental standards within the bounds of political reason, the better natural gas and oil look as energy sources. Stated another way, as long as we use coal anywhere in the world, natural gas and oil looks cheap from an environmental point of view. Nonetheless having grown up in a state without any natural gas or oil resources, we are sympathetic to the substitution of money and machinery to produce clean energy from less desirable raw material. We would put more of that effort into liquefied natural gas and more intensive refining of oil than in coal. Finally, an environmental investment boom could stimulate economic growth. Let Peace Break Out Did we go to war in Iraq for oil or democracy? Instead should President Bush take the passive approach of President Carter? As it turns out, the price of oil went up coincident with the policies of both presidents. Consider an alternative idea that the too-low price of oil may be one of the issues that works against the U.S. in the Middle East. You could say that democratic consuming countries have supported dictatorships that helped keep the price of oil too low as long as possible. Resentment against the dictatorships may stem in part from a perception that the natural resources of the region are being exploited without fair compensation to the people that live in the region. If we are at war in Iraq for democracy, as we hope is the case, will a democracy bring us cheap oil? It may in the sense that it may take less military spending to keep oil flowing. Otherwise, a democratic government may seek more compensation rather than less for its resource. Then it becomes a question of underlying market forces. There is a long-term price of oil that balances demand and supply. No one knows what that price is, but we think a price that rises at a fast, but reasonable, pace gets us there. Continuous AnalysisThere appears to be a strong trend of gradually rising long-term expectations in the oil futures market (see chart Oil Six-Year Futures Strip and 40-Week Average). The latest long-term quote is close to breaching the high of $43.13 reached on October 25, 2004. The average oil price for the next six years in the futures market is $42.91 a barrel (see chart Latest Five Weekly Data Points and Trend). A McDep Ratio of 1.0 implies a stock price consistent with $40 oil constant real. A Weekly Analysis of Energy Stocks Using the McDep Ratio A regular weekly table offers valuation perspective by the McDep Ratio that depends in part on our analysis of value (see table Rank by McDep Ratio). A second weekly table offers valuation perspective by the cash flow multiple without our interpretation (see table Rank by EV/Ebitda). By adding a column on adjusted reserve life we provide a clue to whether the cash flow multiple is at an appropriate level. Besides the weekly Meter Reader we update most of our single stock analyses at least once a quarter (see Index of Recent Research). Also we have a weekly analysis of U.S. Natural Gas Royalty Trusts with related single trust analyses. Growth with Inflation Protection and Deflation Resistance Investment in oil and gas producers offers attractive growth, strong inflation protection and moderate deflation resistance. Growth of oil production may be reasonable while growth in financial value makes it more attractive. Inflation protection is oil’s strong suit. For more deflation resistance, we like the addition of Treasury Inflation Protected Securities to natural gas and oil investments in a conservative portfolio. One of the seldom mentioned features of TIPS is deflation resistance. The principal of TIPS cannot go down below face value. Newly issued TIPS, because they are priced near face value, offer the most deflation resistance. While the inflation protection feature has worked partially, it only covers consumer price inflation. The popular CPI index has missed measuring asset inflation, and its measurement of consumer price has been dampened by quality and substitution adjustments. Nonetheless, we think that TIPS are still better than straight Treasury bonds in portfolio combination with natural gas and oil. TIPS are best held in a tax-deferred or tax exempt account because the high rate of current income taxation applies to the inflation adjustment. I-Bonds, subject to a purchase limit of $30,000 a year per person, require no payment of income tax until they are redeemed. Like the reverse of a fixed rate mortgage, individuals can keep the I-bonds if the thirty-year fixed real rate is advantageous and redeem them without penalty after an initial period if a better thirty-year fixed real rate is available.
Oil and Gas Producers
Rank by McDep Ratio: Market Cap and Debt to Present Value
Oil and Gas Producers Rank by EV/Ebitda: Enterprise Value to Earnings Before Interest, Tax, Deprec.
EV = Enterprise Value = Market Cap and Debt; Ebitda = Earnings before interest, tax, depreciation and amortization; NTM = Next Twelve Months Ended March 31, 2006; P/E = Stock Price to Earnings; PV = Present Value of oil and gas and other businesses
Kurt Wulff was named to the Institutional Investor All-America Research Team 25 times in oil, exploration and natural gas. Also featured in Barron’s and Oil and Gas Investor, he has been a guest on Bloomberg, CNBC, CNN and Wall Street Week with Louis Rukeyser. Mr. Wulff wrote with Bill Bruns, How to Profit from the Coming Oil Crisis, a book published by Bertelsmann three years before Saddam Hussein’s invasion of Kuwait. He is a past president of the National Association of Petroleum Investment Analysts. A Chartered Financial Analyst, Mr. Wulff belongs to the CFA Institute, the Petroleum Analysts of Boston, the Oil Analyst Group of New York, and the Boston Security Analysts Society. In his long career, he has also worked for Exxon, Chevron, and as a consultant for the governments of Alaska, Algeria, and the U.S. Born in Wisconsin, he earned degrees of Bachelor of Science in Chemical Engineering from the University of Wisconsin and Master in Business Administration from Harvard University. |
|||||||||||||||||||||||||||||||||||||||||||||||||||||||||||||||||||||||||||||||||||||||||||||||||||||||||||||||||||||||||||||||||||||||||||||||||||||||||||||||||||||||||||||||||||||||||||||||||||||||||||||||||||||||||||||||||||||||||||||||||||||||||||||||||||||||||||||||||||||||||||||||||||||||||||||||||||||||||||||||||||||||||||||||||||||||||||||||||||||||||||||||||||||||||||||||||||||||||||||||||||||||||||||||||||||||||||||||||||||||||||||||||||||||||||||||||||||||||||||||||||||||||||||||||||||||||||||||||||||||||||||||||||||||||||||||||||||||||||||||||||||||||||||||||||||||||||||||||||||||||||||||||||||||||||||||||||||||||||||||||||||||||||||||||||||||||||||||||||||||||||||||||||||||||||||||||||||||||||||||||||||||||||||||||||||||||||||||||||||||||||||||||||||||||||||||||||||||||||||||||||||||||||||||||||||||||||||||||||||||||||||||||||||||||||||||||||||||||||||||||||||||||||||||||||||||||||||||||||||||||||||||||||||||||||||||||||||||||||||||||||||||||||||||||||||||||||||||||||||||
| Home :: Archives :: Contact |
MONDAY EDITION July 21st, 2025 © 2025 321energy.com |
|