|
TUESDAY EDITION May 6th, 2025 |
|
Home :: Archives :: Contact |
 |
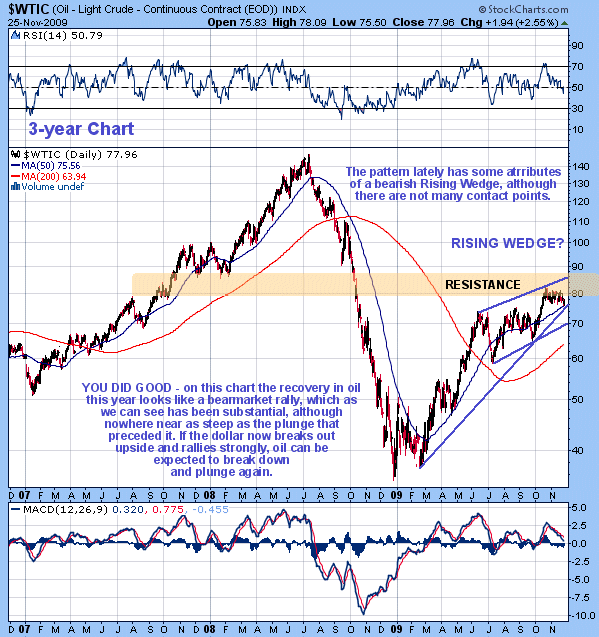
Oil Market UpdateClive Maund support@clivemaund.com December 2nd, 2009 In the last update, which was way back in September, we were looking for an upside breakout from an Ascending Triangle that had been developing in oil up to that point and this is what then occurred. However, the follow through was relatively modest, only carrying the price up to a high at about $82, before it then went into a tight rectangular trading range bounded by about $76 and $81. We can see all of this on the 3-year chart for Light Crude below, although admittedly not in much detail. The reason for using a 3-year chart is that it enables us to compare the rally this year with the severe plunge that preceded it last year and this comparison makes the current rally look like nothing more than a sizeable bearmarket rally, which suggests that another deflationary death spiral is looming. However, we need to be careful not to jump to premature conclusions about this - we need first to see the dollar break out upside from its severe downtrend, which, incidentally, it is very close to doing. If investors and speculators become rattled by the prospect of another credit and liquidity crunch the consequences are likely to be far worse than last year. This is because of the enormous dollar carry trade that has developed this year which has been fuelled by negative real interest rates in the US, and has provided the oxygon for the speculative ramp this year in commodities, stocks and a range of other investments. If the "game over" light comes on again we are likely to see a stampede into the dollar and short-expiry Treasuries, and a collapse in just about everything else - i.e. a rerun of last year, only worse. Gold, however, is likely to weather the storm even better this time round, as it is slowly starting to sink into the skulls of investors that the government paper of a bankrupt country is not the best place to park your funds. 
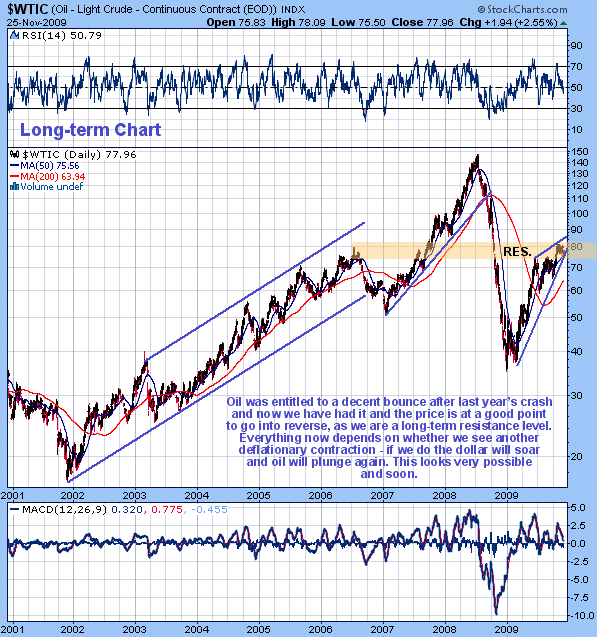
The long-term chart for Light Crude enables us to relate the action since last year's peak to the entire bullmarket in oil during this decade. On this chart we can see that it has recently stalled out at important resistance at the 2006 highs, a good place for it to go into reverse. 
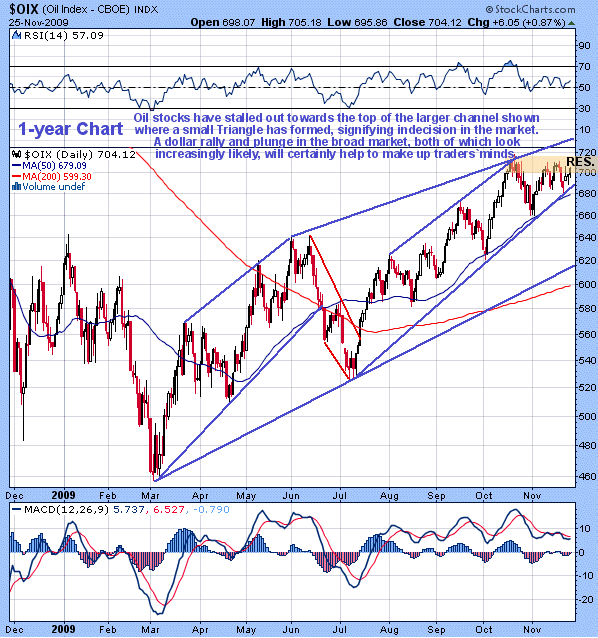
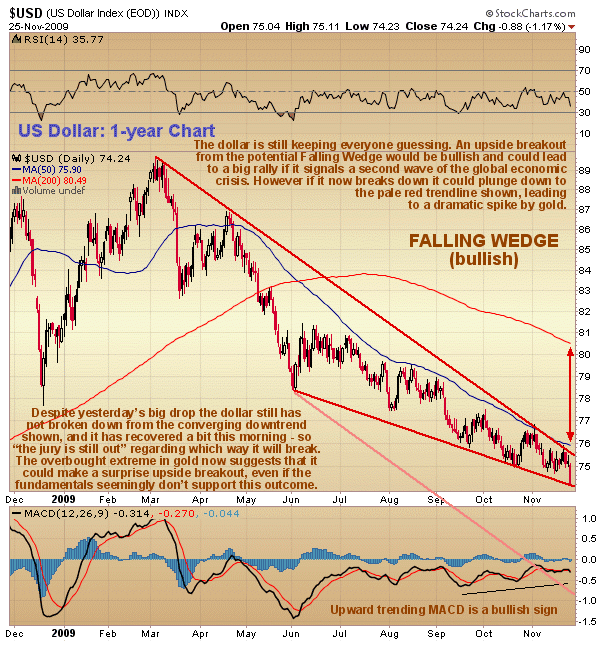
On the 1-year chart for the OIX oil index we can see that oil stocks have stalled out in recent weeks towards the top of the larger uptrend channel shown, where a Triangle has formed, indicating indecision in the market. If this were an Ascending Triangle it would have bullish implications, but if we look carefully we can see that the top line of this Triangle is descending slightly, and anyway the sharp drop in oil overnight and the big drop in broad market futures in the US indicate that this Triangle will probably break to the downside today. As with oil itself, everything now depends on whether we see another deflationary downwave erupt in the near future. The dollar is key - watch to see which way it breaks out of the Wedge pattern shown on the chart below. We were generally stopped out of oil stocks on the early October dip in this index, which broke our steeper supporting trendline across the July, mid-August and early September lows, and so we technically missed out on the early October rally. 
 Clive Maund December 2nd, 2009 support@clivemaund.com Clive Maund is an English technical analyst, holding a diploma from the Society of Technical Analysts, Cambridge and lives in The Lake District, Chile. Visit his subscription website at clivemaund.com .[You can subscribe here]. Clivemaund.com is dedicated to serious investors and traders in the precious metals and energy sectors. I offer my no nonsense, premium analysis to subscribers. Our project is 100% subscriber supported. We take no advertising or incentives from the companies we cover. If you are serious about making some real profits, this site is for you! Happy trading. No responsibility can be accepted for losses that may result as a consequence of trading on the basis of this analysis. Copyright © 2003-2009 CliveMaund. All Rights Reserved. |
| Home :: Archives :: Contact |
TUESDAY EDITION May 6th, 2025 © 2025 321energy.com |
|