|
FRIDAY EDITION May 9th, 2025 |
|
Home :: Archives :: Contact |
|
|
Oil Market UpdateClive Maund support@clivemaund.com November 16th, 2016 After the severe decline in the oil price in 2014 - 2015, which was partly motivated by the Neocon intention to crush the Russian economy as one prong of an asymmetrical warfare campaign that also involved sanctions and a military pressure, the price has marking out a potential base pattern since the middle of last year, as we can see on the 4-year chart for Light Crude shown below. The pattern is looking increasingly like an irregular Head-and-Shoulders bottom, and while it would obviously abort and the price break to lower levels in the event that a general market crash manifests, it is clear that the pattern has the potential to support a substantial bullmarket. This it is interesting to observe the strongly bullish action in copper over recent weeks, which points to a general commodity bullmarket taking hold next year, even if copper is short-term overbought and has signaled that it needs to take a breather. Whilst we can speculate about what may bring this on, it is clear that the election of Trump with his grandiose plans for rebuilding America is likely to be a big factor, although how he plans to finance all this is another matter - probably by means of "helicopter money", which will mean increasing inflation and a commodity bullmarket, especially in gold and silver, that will also be positive for the oil price. For several months the price has been tracking sideways in a trading range bounded by the support and resistance shown, and right now it may be marking out a second Right Shoulder low of the prospective giant Head-and-Shoulders bottom. A clear breakout above the resistance at the top of this range will be a major technical event that will signal a new bullmarket in oil. 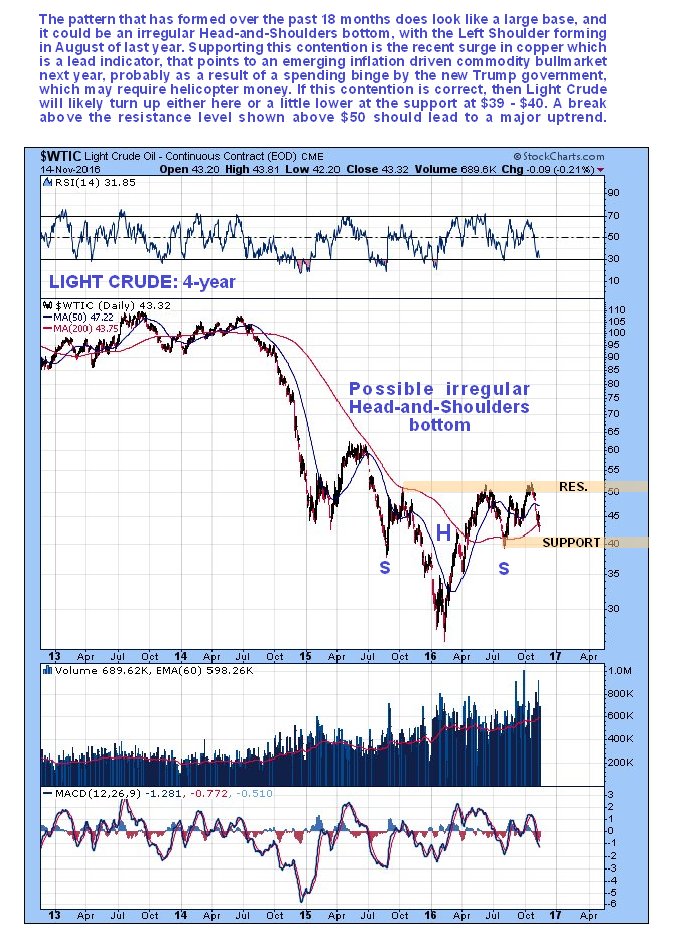 On the 6-month chart for Light Crude we see recent action in much more detail and how the price has dropped quite hard in recent weeks back to the support level in the $43 area which checked the decline of August and September and turned the price back up, and from the action of recent days, during which we have seen a couple of bullish looking candles on gold volume, including a "spinning top" yesterday, it looks like it may be in the process of reversing the intermediate trend from down to up again. In the event that this support fails, all will not be lost, as the larger pattern will not be spoiled unless and until the price breaks the lower support level shown in the $39 - $40 area. As long as this support holds, the Head-and-Shoulders bottom scenario remains intact. 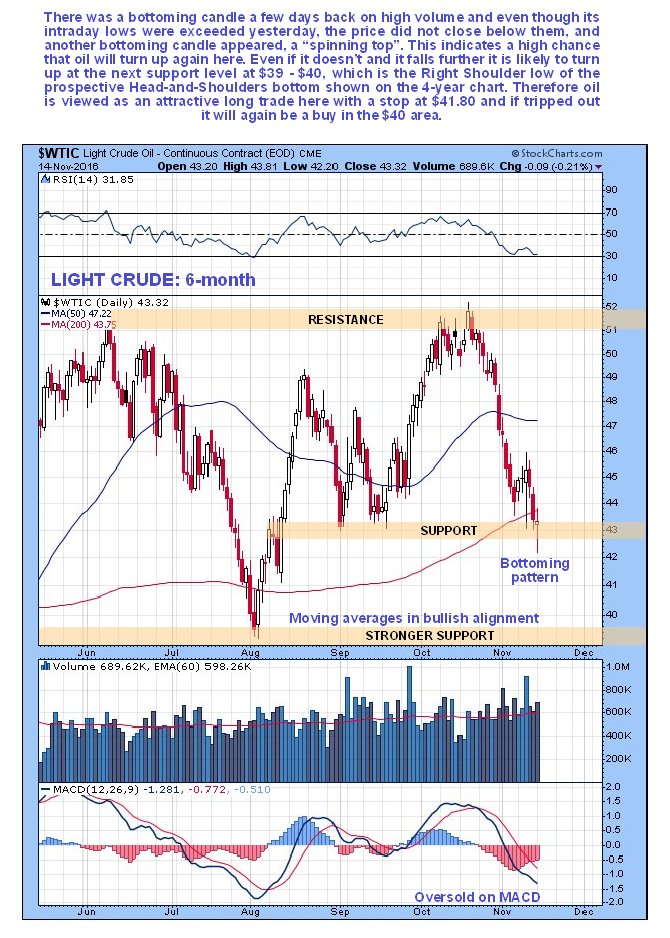 Turning now to oil stocks, we see on the 4-year chart for the XOI oil stock index that it has been stuck in a remarkably tight range for months now, which reflects the state of indecision and standoff in the oil market itself. This index has held up well in recent weeks as oil has dropped, showing good relative strength, which is a positive sign, and it has not dropped to the bottom of its recent range, and with moving averages gradually swinging into more bullish alignment, the chances of an upside breakout from the range are definitely increasing, and of course oil stocks have recently been buttressed by the positive performance of the stockmarket after the Trump victory, which succeeded in breaking above the confines of a large bearish Dome pattern as we saw elsewhere. Should it succeed in breaking out upside from this range, we will likely see sizeable gains made by the better oil stocks. 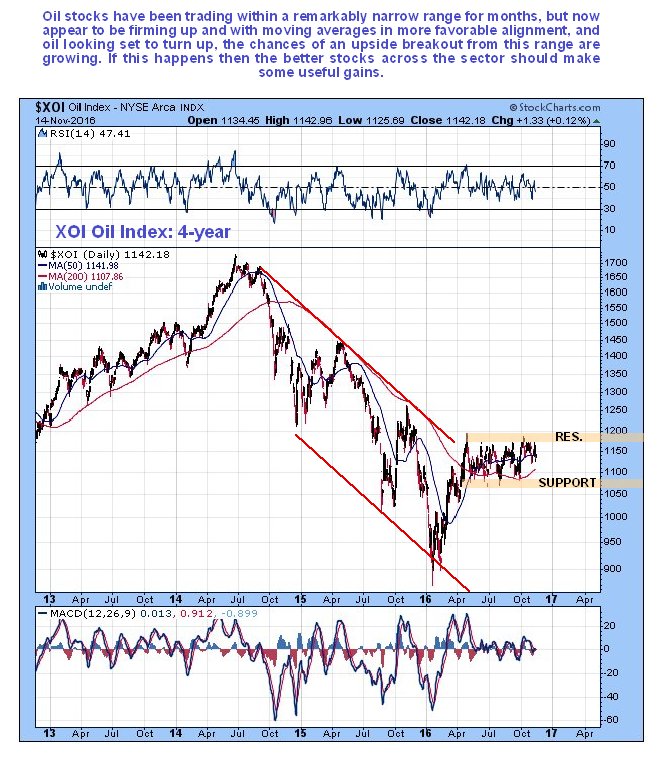 The 6-month chart for the XOI oil index shows that the oil sector has for the most part been a dull place to invest during this period, with it stuck in a trading range bounded by the support and resistance shown. However, this trading range won't last forever, and as we can see there are early signs that the index is set to break out upside from it, with it having only dropped halfway across the range on the recent sharp drop in the oil price, and moving averages swinging into more bullish alignment. 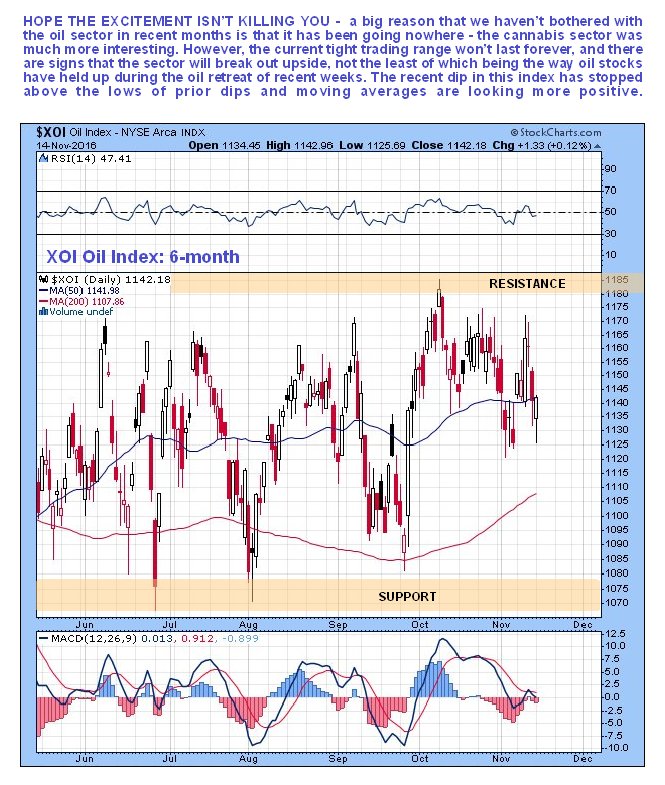 The marked outperformance of oil stocks relative to oil itself in recent weeks is made abundantly plain by the chart below which shows the XOI index relative to the oil price over the past 6-months. This chart suggests that oil will now turn up and further that oil stocks will quite soon break out upside from their 6-month trading range to embark on a significant uptrend. 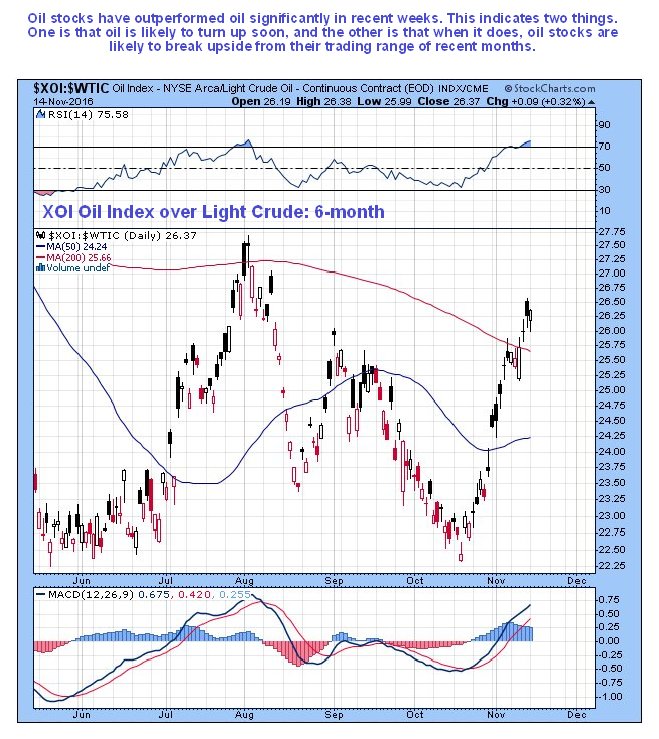 End of update. Clive Maund November 16th, 2016 support@clivemaund.com Clive Maund is an English technical analyst, holding a diploma from the Society of Technical Analysts, Cambridge and lives in The Lake District, Chile. Visit his subscription website at clivemaund.com .[You can subscribe here]. Clivemaund.com is dedicated to serious investors and traders in the precious metals and energy sectors. I offer my no nonsense, premium analysis to subscribers. Our project is 100% subscriber supported. We take no advertising or incentives from the companies we cover. If you are serious about making some real profits, this site is for you! Happy trading. No responsibility can be accepted for losses that may result as a consequence of trading on the basis of this analysis. Copyright © 2003-2012 CliveMaund. All Rights Reserved. |
| Home :: Archives :: Contact |
FRIDAY EDITION May 9th, 2025 © 2025 321energy.com |
|