|
FRIDAY EDITION May 9th, 2025 |
|
Home :: Archives :: Contact |
 |
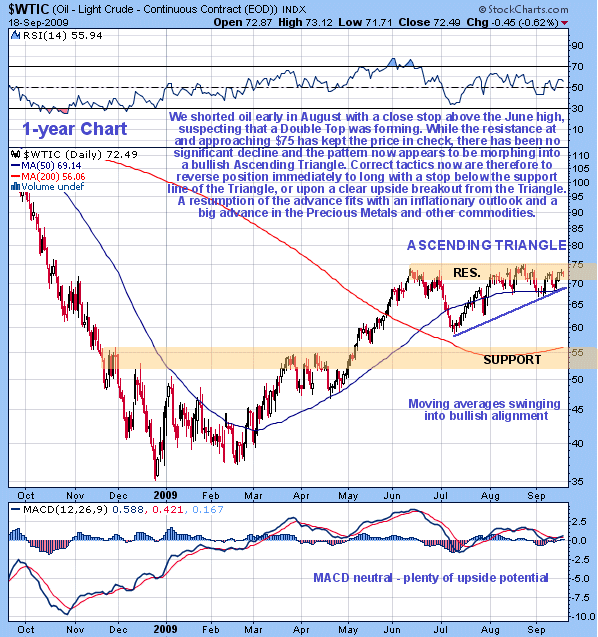
Oil Market UpdateClive Maund support@clivemaund.com September 23rd, 2009 In the last update we suspected that oil might be forming a Double Top with its June highs, and while the resistance towards and at these highs has since kept the price of oil in check, we have not seen the significant reaction expected. Instead, what has happened is that the potential Double Top has morphed into what now looks increasingly like an Ascending Triangle, which is bullish, and this pattern is now well advanced, pointing to an imminent upside breakout.

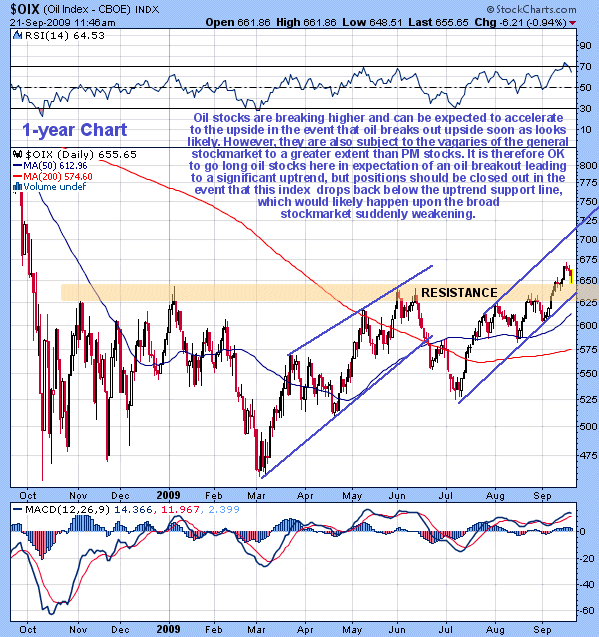
We had a stop above our oil short just above the June highs, and depending on how close you set it you may already have been stopped out when oil tried to break above the resistance in the vicinity of the highs during August. If you were not stopped out you now have 2 choices - one is to reverse position immediately and go long, which will involve a minor loss, probably the best course of action as upside breakout looks highly probable, placing a stop beneath the support line of the Triangle, which would get you out for a small loss if the trade does not work out. The other option is to allow yourself to get stopped out in the event of upside breakout and simultaneously reverse position. This option has the advantage that a new uptrend is more assured, but the disadvantage that it is more costly. We prefer the first option due to an upside breakout now looking much more likely, which fits with an inflationary scenario that drives gold and silver sharply higher. World leaders have amply demonstrated over the past year that they are far more scared of deflationary depression than they are of inflation or even hyperinflation, and since they are not restrained these days by the inconvenience of a gold standard they can and will do just as they please which is to take the line of least resistance by printing as much money as it takes to stave off high interest rates and liquidity problems, which means that the money supply will continue to grow exponentially until the entire system explodes and then comes crashing down in a heap of smouldering ruins. Does this sound alarmist or extreme? - just remember that this is the logical and inevitable result of politicians' natural tendency to take the easy and most expedient way out, which is what enticed them into getting rid of the gold standard in the first place, of course, that has led to the mess we find ourselves in today.  The situation regarding oil stocks is more complicated, for here we have to reckon with the potential collateral damage that might be inflicted by a big drop in the broad stockmarket. On the positive side, we can see on its 1-year chart that the OIX oil stock index is just breaking out upside above the resistance at the top of a broad trading range that started to form nearly a year ago, a development that probably presages an oil breakout to the upside. Moving averages are now in bullish alignment, which helps, although the index is clearly rather overbought at this point, which won't necessarily stop it from advancing. If oil does break out upside soon as expected, then we can expect the oil stocks indices to continue to advance and very possibly accelerate. However, a complicating factor is that oil stocks would almost certainly suffer collateral damage in the event that the broad stockmarket drops significantly. Many investors and traders are expecting a reversal and steep drop in the broad stockmarket, especially as October is just around the corner, but maybe they are worrying needlessly - for the same logic that dictates the ongoing ramping of the money supply worldwide to keep the forces of deflation at bay, also dictates continued bullmarkets in gold, silver, oil, commodities generally, stockmarkets and pretty much anything else that pieces of paper can buy. In any event holders of oil stocks can protect themselves from the damage that a potential drop in the broad stockmarket might inflict by the simple expedient of closing out positions should the OIX oil stock index drop below the trendline support shown on our chart on a closing basis, or (a little lower) below the zone of support also shown, which was resistance until recently. With this safeguard in place it is in order to go long the better oil stocks here. Clive Maund September 23rd, 2009 support@clivemaund.com Clive Maund is an English technical analyst, holding a diploma from the Society of Technical Analysts, Cambridge and lives in The Lake District, Chile. Visit his subscription website at clivemaund.com .[You can subscribe here]. Clivemaund.com is dedicated to serious investors and traders in the precious metals and energy sectors. I offer my no nonsense, premium analysis to subscribers. Our project is 100% subscriber supported. We take no advertising or incentives from the companies we cover. If you are serious about making some real profits, this site is for you! Happy trading. No responsibility can be accepted for losses that may result as a consequence of trading on the basis of this analysis. Copyright © 2003-2009 CliveMaund. All Rights Reserved. |
| Home :: Archives :: Contact |
FRIDAY EDITION May 9th, 2025 © 2025 321energy.com |
|