|
SUNDAY EDITION June 28th, 2026 |
|
Home :: Archives :: Contact |
|
|
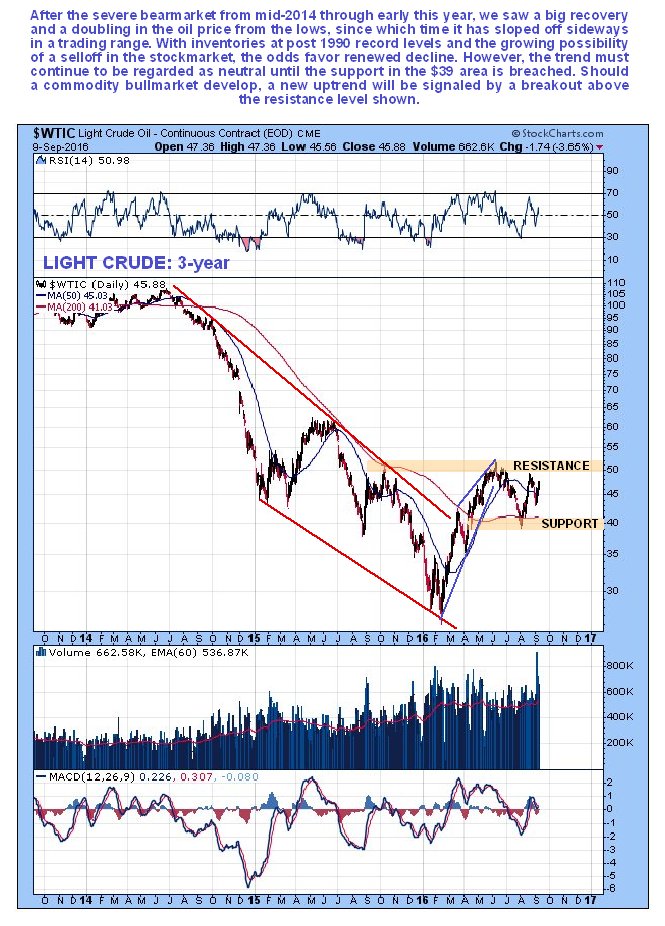
Oil Market UpdateClive Maund support@clivemaund.com September 13th, 2016 US oil inventories have continued to rise to yet another record high. These inventory levels, which used to top out cyclically at about 1.1 billion barrels (for combined inventories of crude, gasoline, distillates and other oils) have now arrived at 1.4 billion barrels. This is their highest level since at least 1990 and going forward they should exert continued downward pressure on oil prices, and this downward pressure is likely to be exacerbated if we see weakness in the economy, which will be presaged by falling markets, and markets have just started falling, dragging oil prices lower already. Despite the above fundamentals, the charts for oil don't actually look all that bad at this time. On the 3-year chart for Light Crude, we can see that after the severe bearmarket from mid-2014 through early this year, which resulted in extreme lows that were ruinous for the industry, the price has bounced back towards more normal levels, and has now stabilized in a converging trading range. While the fundamentals do suggest that the big recovery rally this year was a bearmarket rally and that lower prices lie ahead, this chart is technically neutral with a slight upward bias, since the 50-day moving average is above a slightly rising 200-day.


Clive Maund September 13th, 2016 support@clivemaund.com Clive Maund is an English technical analyst, holding a diploma from the Society of Technical Analysts, Cambridge and lives in The Lake District, Chile. Visit his subscription website at clivemaund.com .[You can subscribe here]. Clivemaund.com is dedicated to serious investors and traders in the precious metals and energy sectors. I offer my no nonsense, premium analysis to subscribers. Our project is 100% subscriber supported. We take no advertising or incentives from the companies we cover. If you are serious about making some real profits, this site is for you! Happy trading. No responsibility can be accepted for losses that may result as a consequence of trading on the basis of this analysis. Copyright © 2003-2012 CliveMaund. All Rights Reserved. |
| Home :: Archives :: Contact |
SUNDAY EDITION June 28th, 2026 © 2026 321energy.com |
|