|
WEDNESDAY EDITION June 24th, 2026 |
|
Home :: Archives :: Contact |
|
|
Oil Market Update...Clive Maund July 27th, 2020 Compared to the wild volatility that we witnessed back in the Spring, trading in oil has become very light and subdued, with volatility in it dropping to a very low level, and as a result many traders are losing interest in it. It is quiet - too quiet - and complacency towards it is now rife, but as we will see, there are signs that this may all be about to change, and fast. We'll start by looking at the year-to-date arithmetic chart for Light Crude on which we can see all of the dramatic developments this year. After deteriorating early in the year, the oil price accelerated to the downside, plunging early in March with a big gap down and then it continued to weaken into mid-April when a sudden huge drop left some contracts not just worthless, but actually having negative worth, meaning that if you took delivery you had to in effect pay someone to take it away, for an amount that exceeded what the oil was actually worth. Clearly, this was a situation that was untenable because so much depends on the oil price, so the Fed and the Military - Industrial complex worked all the levers at their disposal to get the price back up again, which of course included creating trillions of new dollars to throw at the problem, and to throw at the markets generally, especially the "window dressing" FAANG stocks. Up to now this has worked and we have seen a recovery rally of astounding proportions in the stockmarkets, especially the Tech sector, and a respectable recovery in the oil price, and what makes all this even more astounding is that it has happened as the real world economy has been frozen by widespread lockdowns, the main purpose of which is to kill the velocity of money so that the Fed can print trillions and buy up everything without it feeding through immediately into hyperinflation - that will come later. 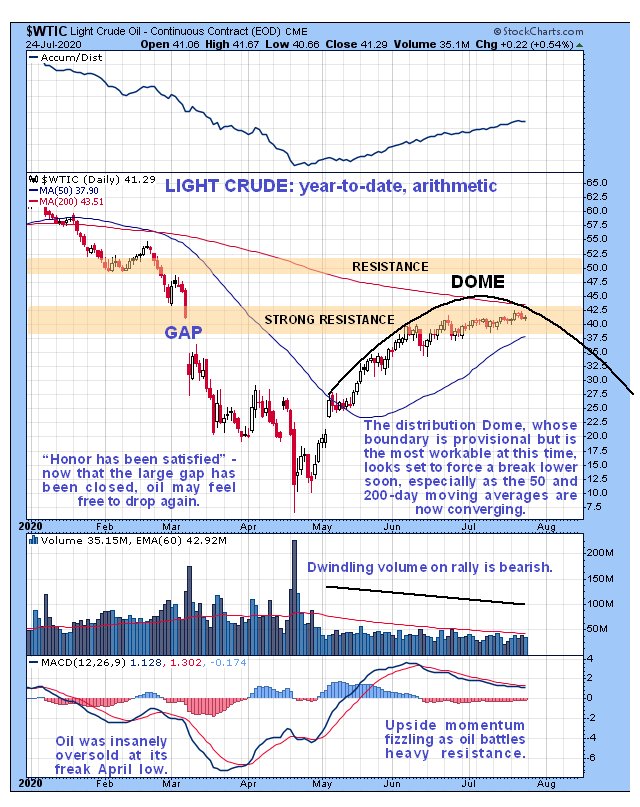 It is worth looking at the log chart for Light Crude for the same timeframe, as it makes starkly clear the enormous percentage swings in the oil price during the period of extreme crisis back in the Spring, and the comparatively miniscule percentage price changes in recent weeks. 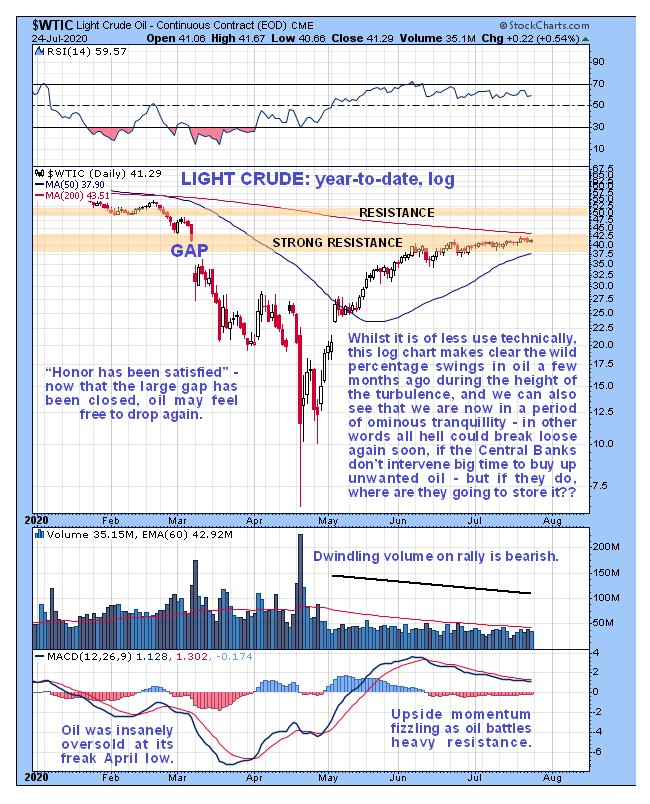 The 2 main factors that have driven the oil price back up from its April lows are a concerted and comprehensive campaign of manipulation and strategic support using trillions of dollars created for the purpose, coupled with the widespread and mistaken belief that the lockdowns will end and the world will start to return to normal, which is not going to happen - a return to the world as it was before is simply not going to be permitted. What this means is that the old fashioned daily commute to the office by millions in their vehicles is for many going to be a thing of the past, as they will either be jobless or working from home, and the same goes for mass travel - overseas trips will become an expensive hassle that will be out of reach of most people. The result of these huge changes will be vastly reduced oil consumption, and once that reality sinks in the oil price could very well crash again, and that will be necessary to disincentivize producers from delivering product to the market that is surplus to requirement and cannot be stored. Many in the oil industry are now living in "cloud cuckoo land" mistakenly believing the old days of profligate consumption are coming back when they are not - our illustrious leaders have decided to tackle climate change head on, assisted by the super hyped virus hysteria - and that means a vast reduction in the consumption of oil. Given that most people are like children and won't make sacrifices voluntarily, those in control have conspired to create a situation where they are forced to change. Now we will zoom out to put recent moves in the oil price in perspective by means of a range of longer-term charts. The 1-year chart is interesting as it makes clear where things started to unravel for oil. We can see the origins of the upper support level in the $49.50 - $52 zone that once breached, set off the brutal cascading decline, and how, after it failed there was a brief pullback rally early in March towards the failed support that presented a "once in a blue moon" shorting opportunity, after which the price plunged. This chart also makes clearer that the current moving average alignment is very bearish, with the price advance fizzling out at heavy resistance beneath the steadily falling 200-day moving average, and the 50-day rising up towards it but in position to quickly rollover and drop in the event of the price turning lower as expected, without first breaking above the 200-day. If this is how it turns out it could set oil up for another waterfall decline. 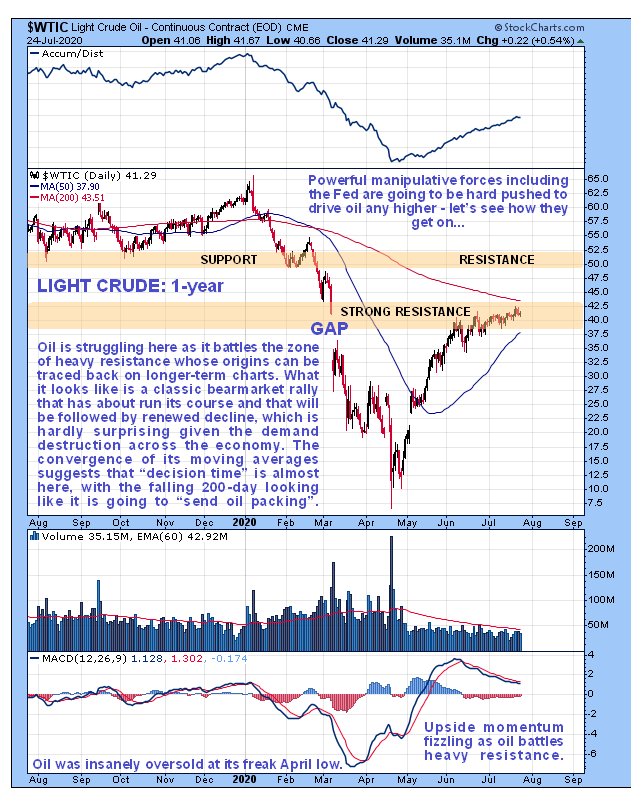 The 5-year chart is useful as it enables us to see the origins of the strong resistance that has gradually brought the current advance to a dead stop and is now increasingly threatening to force oil back down again. It arises from the trading at and above the current price during the years 2015 through 2018. 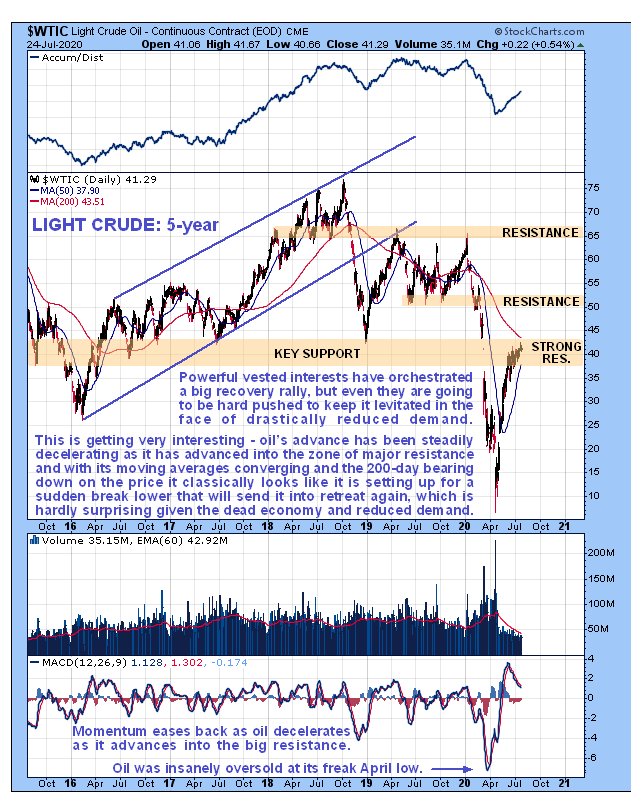 Finally, on the 10-year chart, we see that oil takes major support and resistance levels seriously. As clear examples we see that oil's advance in 2018 was capped by strong resistance at the underside of a large trading range that built out from 2011 through 2014, and then that support at or near to the lows in 2015, 2016 and 2017 later came into play to halt and reverse the sharp drop that occurred late in 2018. Therefore, as oil takes major support and resistance levels seriously, and it is right now stalled out at a major resistance level, we are going to take it seriously too, because it very likely means that a breakdown into a serious decline is going to occur soon. 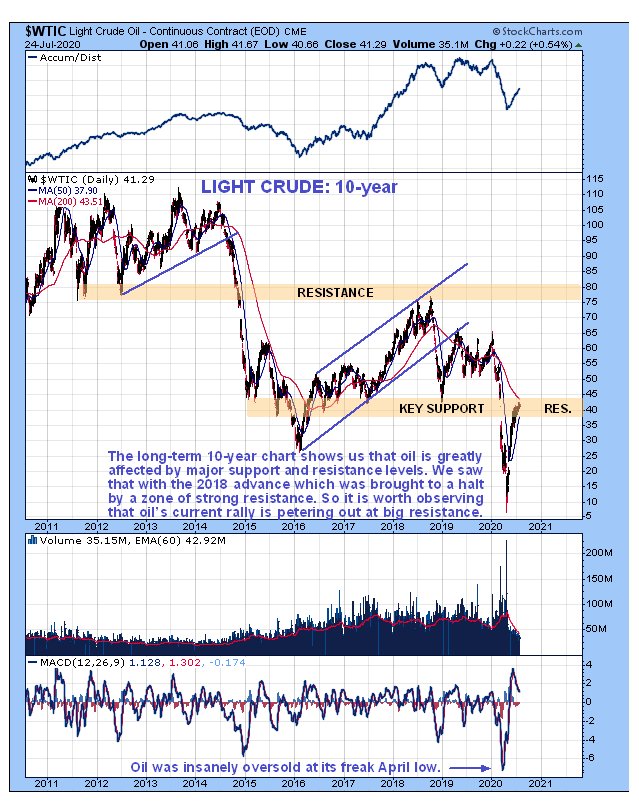 End of update. Clive Maund July 27th, 2020< support@clivemaund.com Clive Maund is an English technical analyst, holding a diploma from the Society of Technical Analysts, Cambridge and lives in The Lake District, Chile. Visit his subscription website at clivemaund.com .[You can subscribe here]. Clivemaund.com is dedicated to serious investors and traders in the precious metals and energy sectors. I offer my no nonsense, premium analysis to subscribers. Our project is 100% subscriber supported. We take no advertising or incentives from the companies we cover. If you are serious about making some real profits, this site is for you! Happy trading. No responsibility can be accepted for losses that may result as a consequence of trading on the basis of this analysis. Copyright © 2003-2017 CliveMaund. All Rights Reserved. |
| Home :: Archives :: Contact |
WEDNESDAY EDITION June 24th, 2026 © 2026 321energy.com |
|