|
FRIDAY EDITION May 9th, 2025 |
|
Home :: Archives :: Contact |
 |
Oil Market updateby Clive Maundwww.clivemaund.com July 12th, 2006 There is a lot of talk going around on the internet about oil and oil stocks rising to wondrous heights - wondrous that is if you are long oil or oil stocks. However, as we know from long experience, when this kind of talk becomes the norm it is often the time to watch out - remember the fantastic fundamentals for silver just before it hit a wall? Rather than going all out to “make a killing” we will therefore make common sense and prudence our watchwords with respect to this market at this time, and implement a strategy that will enable us to be around to make the same profits as the raging bulls, but be conspicuous by our absence in the event that this market heads south. Fortunately this is not hard to do at this time, because of the position oil and the oil stocks indices relative to their respective support and resistance levels.
Looking at the 1-year chart for West Texas Light Crude, we can see that it has performed well recently, as predicted in the last comment on it some weeks back, but although it attained a new high as expected, the break higher was marginal and it has turned abruptly lower over the past few days. While this action constitutes failure at resistance, with the attendant risk of a return to the lower boundary of the trading range, the nature of the advance, which broke above the early June highs, and the vigorous nature of the attendant advance in oil stocks suggests that there is a fair chance that it will not return to the bottom of the trading range before turning higher and breaking out upside from the trading range. The correct strategy for oil traders is therefore to stay long if you did not get out a few days back near the peak, and to buy on a drop into the $68 - $69 support zone, with a stop not far below $68, or, in the event that it does not drop back that far before turning and making a run at the equally clear resistance in the $75 - $76 zone above, buying on a break above $76. This strategy obviously involves the risk of being whipsawed out, but there is nothing new about this, it is always the case when you implement a strategy designed to capitalize fully on a move, but strictly limit possible losses. Note that the freak spike at the end of May is a data error.
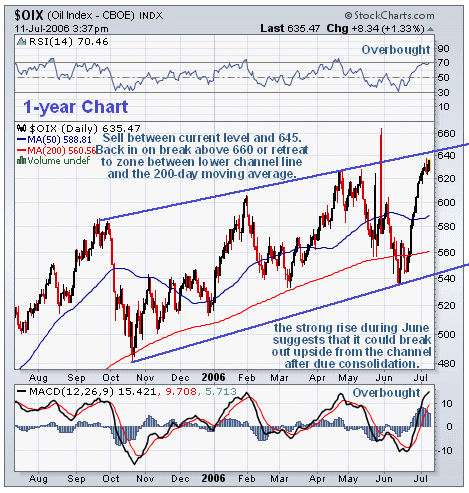
 We have a similarly clear situation with oil stocks themselves. On the 1-year OIX oil stock index, we can see the impressively strong rise in late June, which suggests a possible upside breakout from the uptrend channel, which in recent months, as we have previously observed, has been contracting and thus forming a potential bearish Rising Wedge. However, the steep rise in the index has taken its RSI and MACD indicators approaching normal overbought limits. Thus, the least we can expect to see in the immediate future is a period of consolidation beneath the upper channel line before which an upside breakout would be very unlikely. More probable is a reaction back within the channel, although, in parallel with oil itself, the reaction may not run right back to the lower channel boundary, due to the strength implied by the steep rise in June. The strategy for oil stocks differs somewhat from oil itself, because none of the recent gains have so far been lost. Therefore it makes sense for traders to take profits/partial profits at current prices, and on any further short-term advance up to about 645, should it get that far, and repurchase in the unlikely event of an upside breakout from the channel, signalled by a close above 660. If the index takes the more probable course and rolls over to head back towards the lower channel boundary, stocks can be bought again as it approaches the zone between the lower channel boundary and the 200-day moving average, currently the 545 to 560 area, new positions being closed out in the event of a clear break below the channel boundary, should that subsequently occur. This strategy set out here puts traders in position for profit from an upside breakout by oil and oil stocks, or from a retreat to support, whilst strictly limiting risk, with an acceptable risk of being whipsawed out of the market.
Clive Maund |
| Home :: Archives :: Contact |
FRIDAY EDITION May 9th, 2025 © 2025 321energy.com |
|