|
TUESDAY EDITION June 9th, 2026 |
|
Home :: Archives :: Contact |
|
|
Oil Market UpdateClive Maund support@clivemaund.com March 8th, 2009 We have hardly looked at the oil sector for almost 2 months, and quite frankly the reason for this was that the outlook for the sector was simply too boring. However, the times they are a changin' and there is growing evidence that a sizeable rally in the sector is brewing.
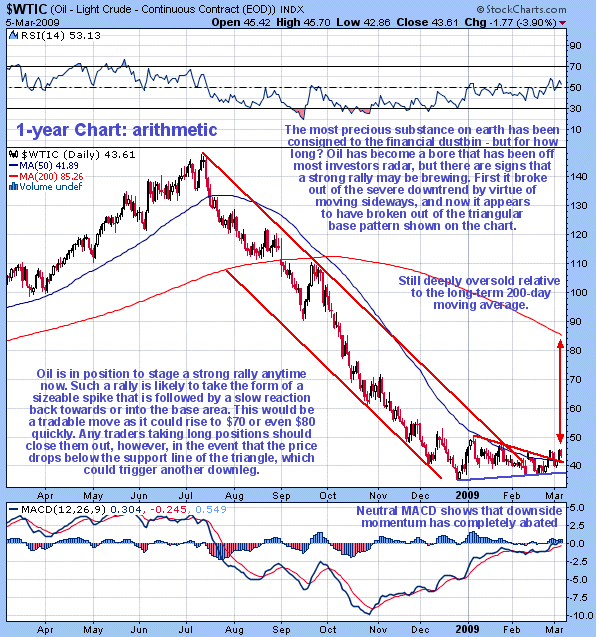
On the 1-year chart for Light Crude we can see that there have been important positive developments over the past couple of months that have created the potential for a strong rally. The sideways action during this period has resulted in oil breaking out of the severe downtrend that had shaved over 75% off the price of the world's most important commodity - a truly incredible loss. In addition, just a couple of weeks ago, oil appears to have broken out of the Symmetrical Triangle potential base area that has formed from the late December low. After dipping back into the triangle it broke out of it again a couple of days ago so that its upside potential is steadily improving. With the MACD indicator having returned to neutrality, downside momentum has now completely abated. The continuing large gap between the price and 50-day moving average which are almost coincident and the 200-day moving average are an indication of how oversold oil remains despite the recent sideways movement, and also an indication of just how much scope there is for a rally. If the market should suddenly "see light at the end of the tunnel" with regard to the acute banking and financial crisis, and the broad stockmarket rally strongly as a result, then oil could easily spike upwards from here to the $70 or even the $80 area very quickly, although it would probably drift back down slowly afterwards before picking up again later, as these kinds of moves always get overdone. Oil is therefore considered to be a strong buy here, with a stop below the lower line of the triangle, as should it break below this line it will signal that another downleg has probably begun. 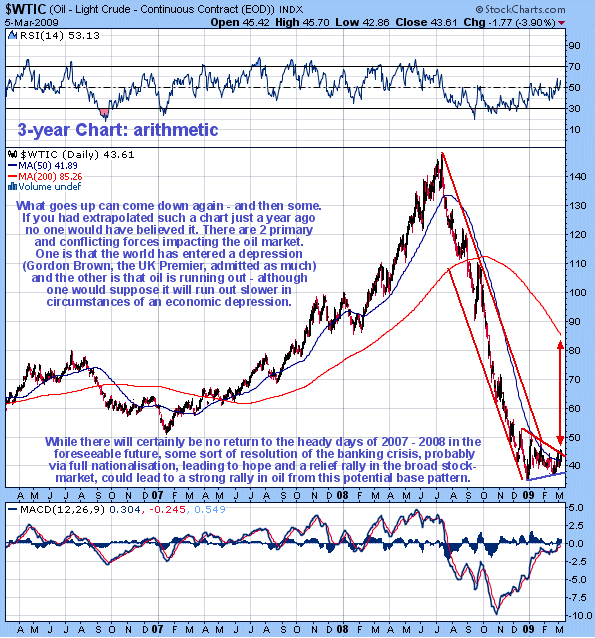
The 3-year chart for Light Crude puts the recent savage decline into more perspective and enables it to be compared with the parabolic ramp that preceded it. 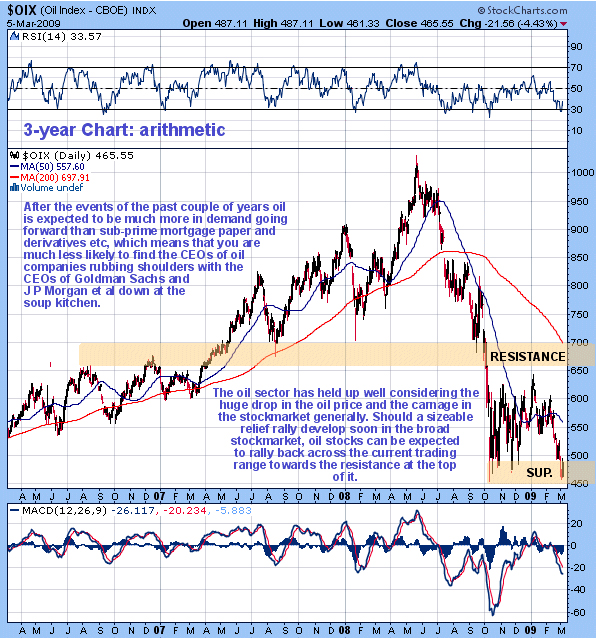
The 3-year chart for the OIX oil index shows that oil stocks have held up well compared to many sectors. One reason for this is that until a few months ago oil companies had so much money that they didn't know what to do with it following the bonanza years. This index has been stuck in a large trading range from early October up until the present bounded by about 450 and 650. Now it is clear that if it can hold above the bottom of the range until the broad market rout has run its course - which we may be close to - it will open up the prospect of a substantial and tradable rally back up towards the top of the trading range again, which would result in significant percentage gains.
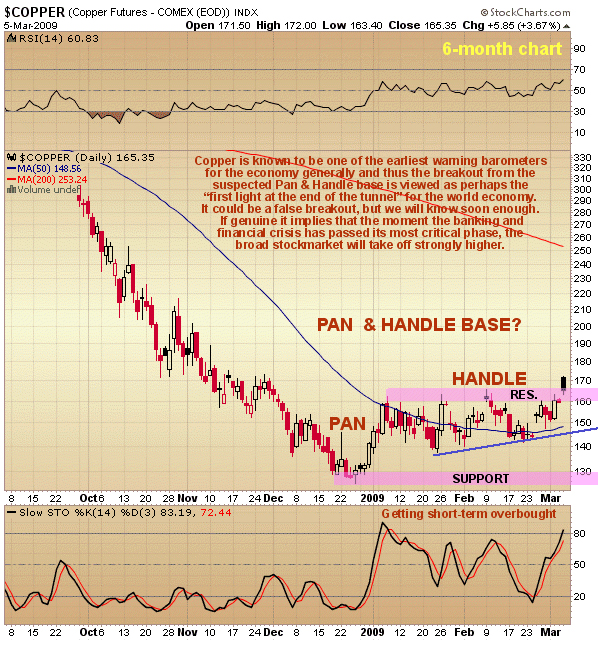
It may seem odd to include a chart for copper in an Oil Market update, but there are good reasons for doing so. Demand for both copper and for oil is dependent on the health of the world economy, and this explains the remarkable similarity between their charts over the past several months. The copper price is known to serve as an "early warning system" for the state of the world economy, and thus it will certainly be of interest to oil traders to observe that copper yesterday broke out to a 3-month high, and in so doing broke out from what appears to be a bullish "Pan & Handle" base area. If this breakout is genuine - and we will know soon enough - then this move by copper might be the "first light at the end of the tunnel" signaling that some kind of resolution of the global banking and financial crisis is close at hand. This will probably involve full across-the-board nationalisation, which would be the easiest way out that would allow the bill for the entire mess to be pushed off onto the taxpayer.
Clive Maund March 8th, 2009 support@clivemaund.com Clive Maund is an English technical analyst, holding a diploma from the Society of Technical Analysts, Cambridge and lives in The Lake District, Chile. Visit his subscription website at clivemaund.com .[You can subscribe here]. Clivemaund.com is dedicated to serious investors and traders in the precious metals and energy sectors. I offer my no nonsense, premium analysis to subscribers. Our project is 100% subscriber supported. We take no advertising or incentives from the companies we cover. If you are serious about making some real profits, this site is for you! Happy trading. No responsibility can be accepted for losses that may result as a consequence of trading on the basis of this analysis. Copyright © 2003-2008 CliveMaund. All Rights Reserved. |
| Home :: Archives :: Contact |
TUESDAY EDITION June 9th, 2026 © 2026 321energy.com |
|