Oil Market Update
Clive Maund
support@clivemaund.com
March 4th, 2016
Oil did exactly as predicted in the last Oil Market update, posted in the middle of November, when a steep drop was forecast to take it down into the $20's. No update has since been posted because we were waiting for the decline to run its course, and then we weren't reasonably sure that it had bottomed until recent days, and when we talk about it having bottomed here we mean an intermediate bottom, not necessarily a final bottom.
On the 6-month chart for Light Crude we can see that the picture has brightened considerably over the past couple of weeks, and especially over the past few days. This is because it first broke out of the intermediate downtrend shown, which was an important positive development, and then it went on to battle its way above its falling 50-day moving average and finally over the past day or two its looks like it is breaking out above the resistance at the top of the suspected intermediate base pattern. The persistent heavy volume from early - mid-January is a sign of a probable reversal, although it is too early to say at this juncture whether it is a final bottom or an intermediate bottom that will eventually be followed by new lows. This suspected bottom projects a rally towards the next resistance level shown and the falling 200-day moving average.
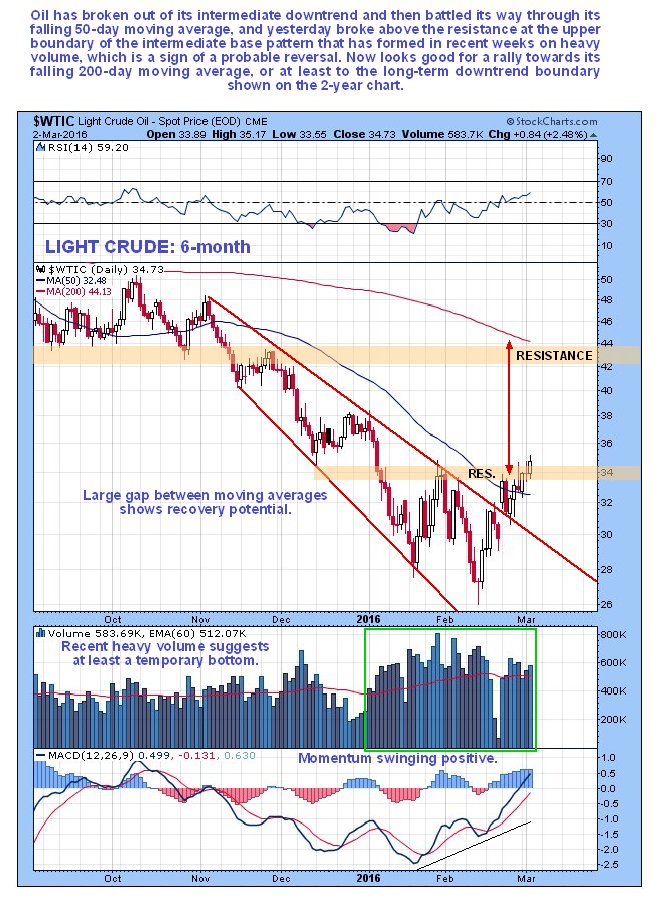
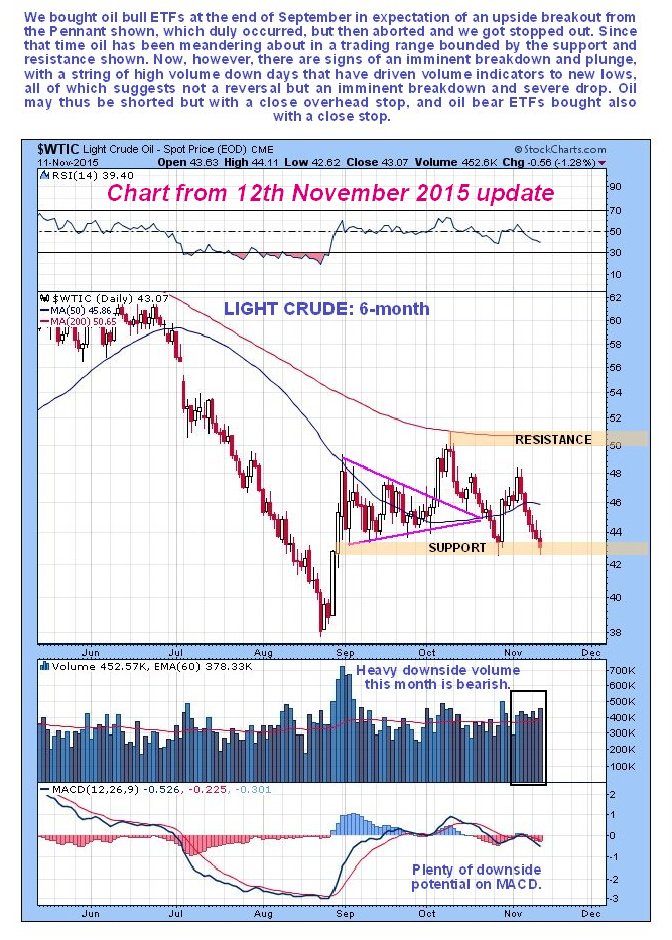
Chart from mid-November update...
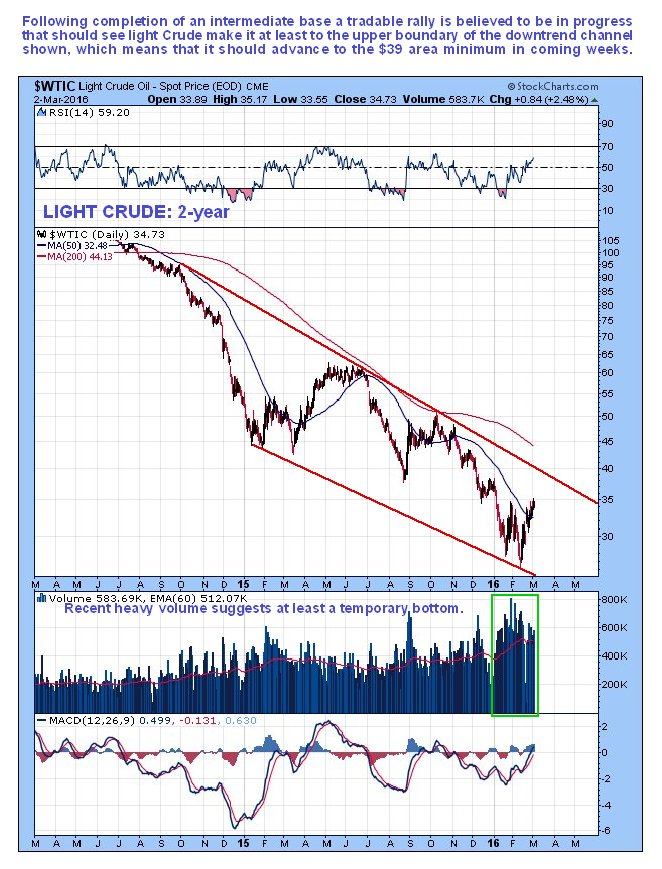
On the 2-year chart we can see the long-term downtrend in force from mid-2014. A recovery rally here may not get as far as the 200-day moving average, since it might get capped by the upper boundary of the downtrend channel. Even so, if it makes it there it will get to about $39, which would be a tradable rally that would result in good gains in many beaten down stocks across the sector. Such a rally looks likely given that the outlook for the broad market is now positive over the short to medium-term.

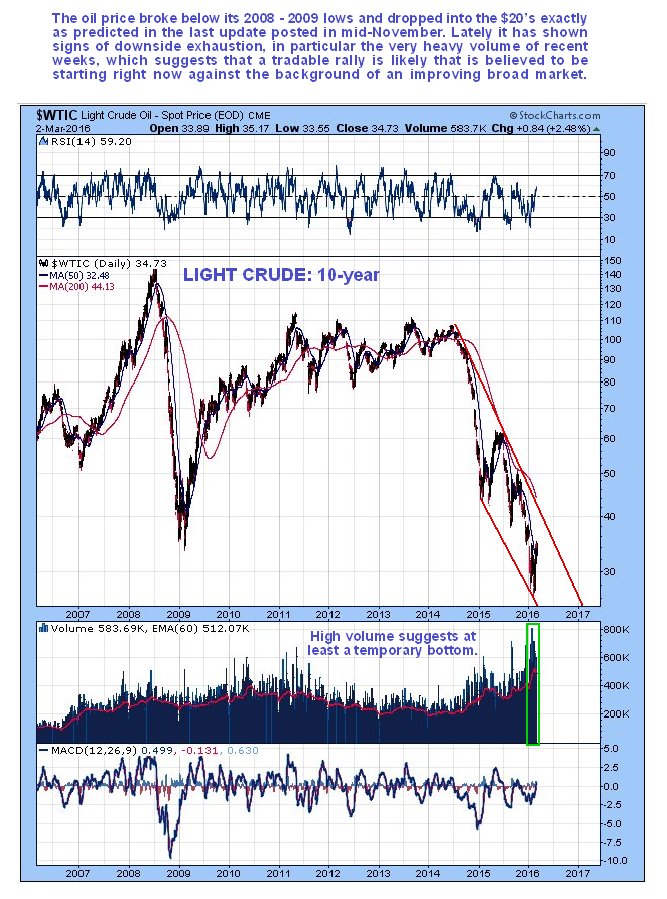
The long-term 10-year chart shows how the latest severe downleg took the oil price way below its 2008 - 2009 crash lows, despite the broad market itself not crashing. What this means is that if the broad market does later crash, oil could easily end up in the teens. The recent very heavy volume, that can be seen more in context on this long-term chart, is a sign of at least a temporary bottom.
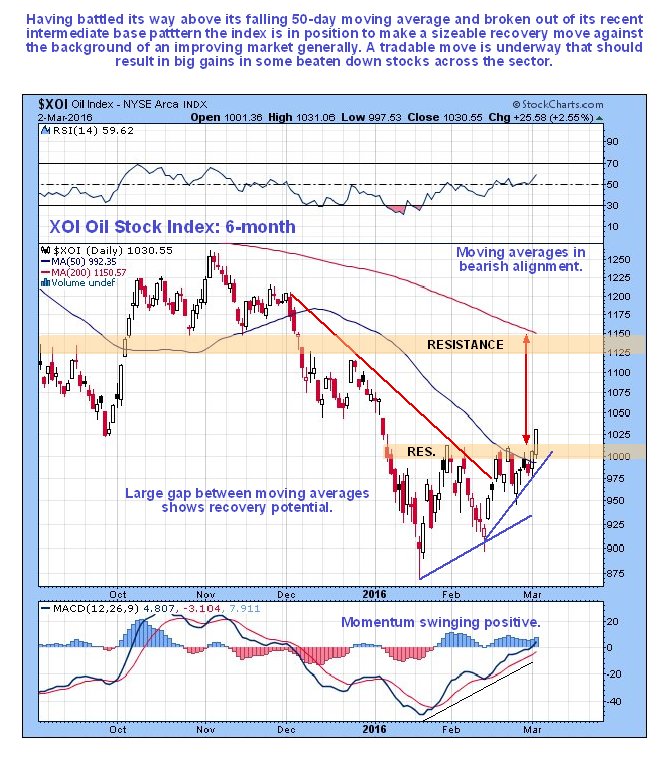
Compared to oil itself, oil stocks got off light, and have not dropped below their 2008 - 2009 crash lows. The reason for this is simple to understand - it is because the stockmarket has not crashed - yet, although it may do later. On the 6-month chart for the XOI oil index, we can see how it dropped hard from mid-November into mid-January, exactly as predicted in the last update, and it has since thrashed around marking out an intermediate base pattern from which it only started to emerge yesterday, after first breaking out of the downtrend shown and then battling through its falling 50-day moving average, which it only succeeded in breaking clear above yesterday. Yesterday was an important positive day when not only did the XOI succeed in breaking clear above its 50-day moving average, but also it broke clear out of the intermediate base pattern of recent weeks. This action signifies that it is commencing a recovery uptrend that will probably take it to the upper boundary of the downtrend shown on the 2-year chart, resulting in significant gains in many trampled down undervalued oil stocks. This expected move should unfold against the background of the broad market advancing during the same timeframe.

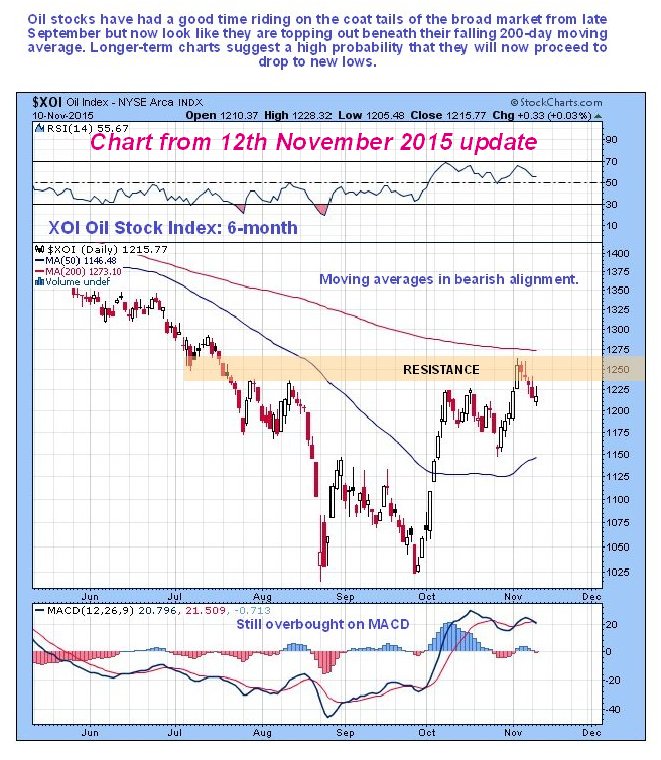
Chart from mid-November update...
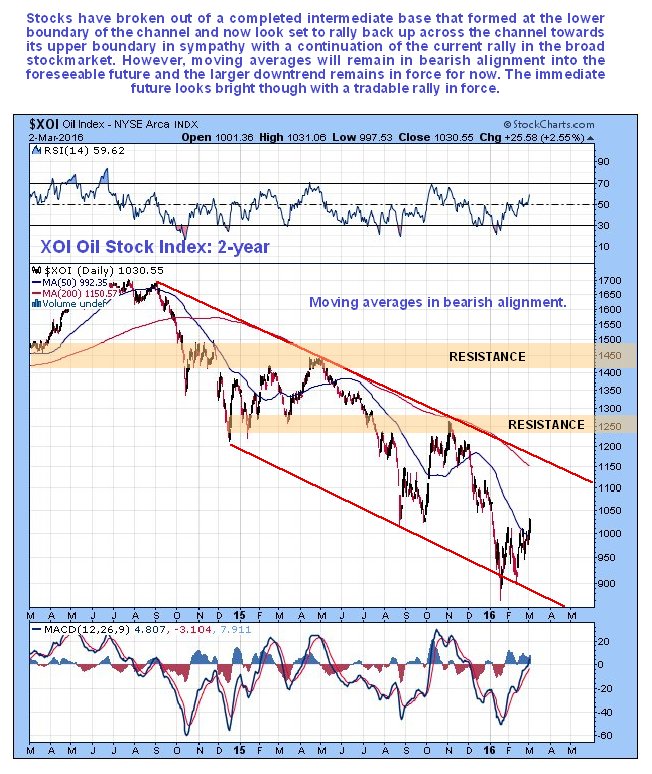
On the 2-year chart we can see how, having completed an intermediate base above the lower boundary of the long-term downtrend shown, the XOI is in position to stage a tradable rally across the downtrend channel. However this downtrend remains in force with moving averages in bearish alignment, and so may reassert itself after the expected rally back across the channel.
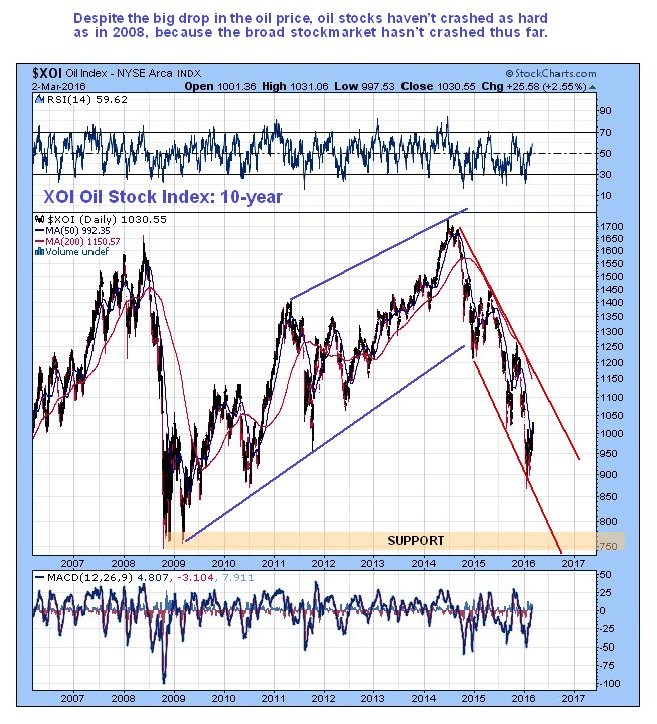
The long-term 10-year chart for the XOI index is interesting and worth comparing to the 10-year chart for oil itself, for while oil dropped to new lows - well below its 2008 - 2009 crash lows - the XOI index did not drop as far as its 2008 - 2009 crash lows on its recent drop. The reason for this is simply that this time round the broad stockmarket has not crashed - yet, at least.

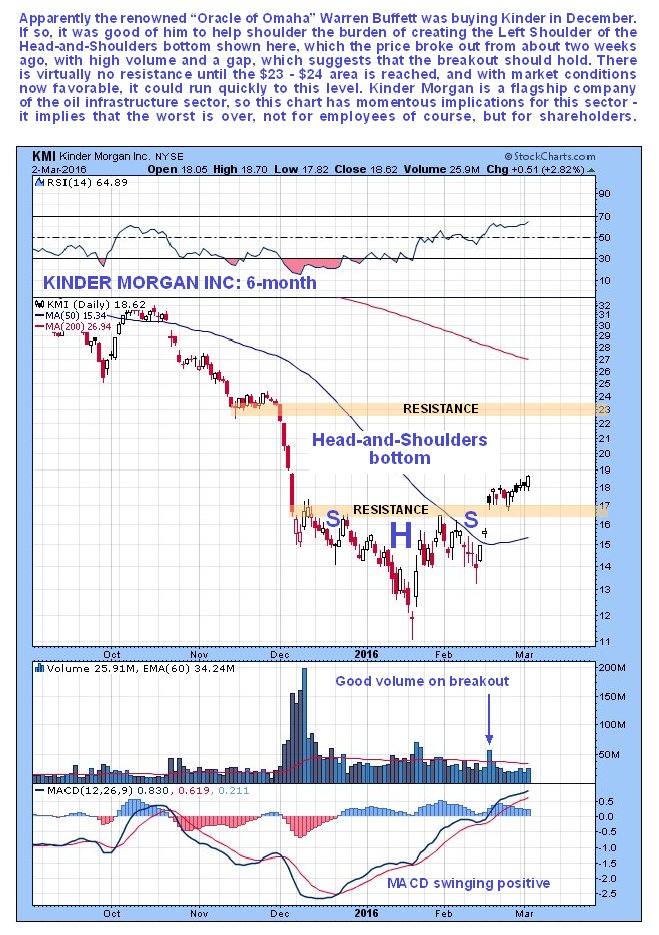
For those of you who may be wondering, looking at the 6-month chart for Light Crude shown above, “Couldn't it drop down to form a Right Shoulder at a similar level to the mid-January dip?” the answer is yes it could, but it doesn't look likely given what it has just achieved. Also the chart for Kinder Morgan, which we bought about a week ago, has already completed a Head-and-Shoulders bottom and is starting to advance away from it, suggesting that the sector at large will not tarry and will advance from here.
Clive Maund
March 4th, 2016
support@clivemaund.com
Clive
Maund is an English technical analyst, holding a diploma from
the Society of Technical Analysts, Cambridge and lives in The Lake District, Chile.
Visit his subscription website at clivemaund.com .[You can subscribe
here].
Clivemaund.com is dedicated to serious investors and traders in the precious metals and energy sectors. I offer my no nonsense, premium analysis to subscribers. Our project is 100% subscriber supported. We take no advertising or incentives from the companies we cover. If you are serious about making some real profits, this site is for you! Happy trading.
No responsibility can be accepted for losses that may result
as a consequence of trading on the basis of this analysis.
Copyright
© 2003-2012 CliveMaund. All Rights Reserved.