|
MONDAY EDITION June 8th, 2026 |
|
Home :: Archives :: Contact |
|
|
Oil Market UpdateClive Maund support@clivemaund.com January 11, 2009 We called the bottom in oil too early in the last update posted on 16th November, for it continued even lower to become even more deeply oversold. Now, however, we appear to be at the optimum entry point for oil from a time/price perspective, for a clear reversal pattern has developed, a Head-and-Shoulders bottom, with the price in recent days backing off to mark out the Right Shoulder low of the pattern. We can clearly see this Head-and-Shoulders bottom on the 8-month chart for Light Crude, a time period selected to show the downtrend from the July peak in its entirety. Superficially this extraordinarily severe downtrend makes the "Peak Oil" crowd look like fools, but we must remember that in the larger scheme of things this plunge is a temporary phenomenon resulting from a blind panic out of just about everything by speculators scared witless at the specter of deflation. Right now they think that they have found safe haven in Treasuries, but the reality is that while oil has real demonstrable intrinsic value, bonds have none and can quickly become worthless pieces of paper, as many bond holders are destined to find out the hard way in due course. A big problem for US treasury holders in particular is that the US happens to be bankrupt, and bankrupt countries have an unfortunate tendency to renege on debts. Returning to the chart, there are additional factors pointing to a sizeable rebound in oil. One is that it is massively oversold after the prolonged and brutal downtrend as made clear by the current huge gap between the price and its 200-day moving average, and between the 50 and 200-day moving averages, which is so enormous that it calls for a substantial relief rally even in the event that the bearmarket is set to continue, which is not believed to be the case. The slowing of the downtrend that has allowed the price to close up the gap with its 50-day moving average as the Head-and-Shoulders bottom has developed has created the conditions for an upside breakout. While the rising trend of the MACD indicator has resulted in it returning towards the zero line, that could be said to have renewed downside potential, this development is frequently a precondition for an upside breakout, especially when other factors point to it, as is the situation here. 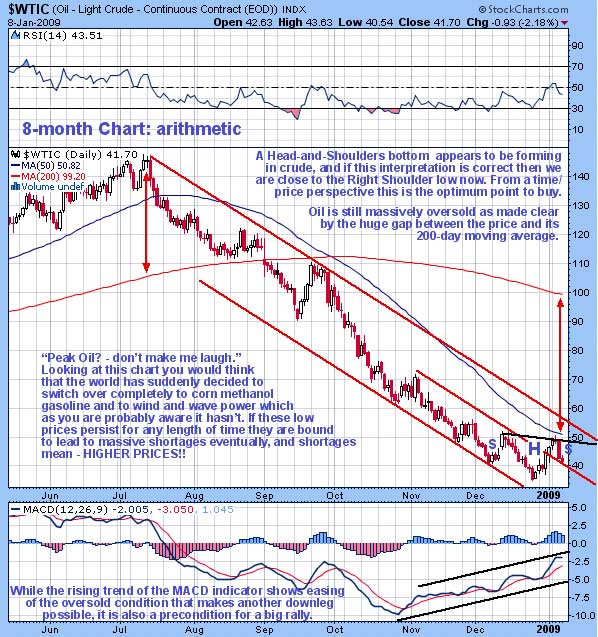
With the price having dropped down to form what looks like the Right Shoulder low of a clearly identifiable Head-and-Shoulders bottom we appear to be at the optimum entry point for traders to go long oil here, from a time/price perspective - meaning maximum gains in the minimum timeframe. The 3-year chart for Light Crude is interesting as it enables the extraordinary collapse of the past 6 months to be compared to the major advance that preceded it. 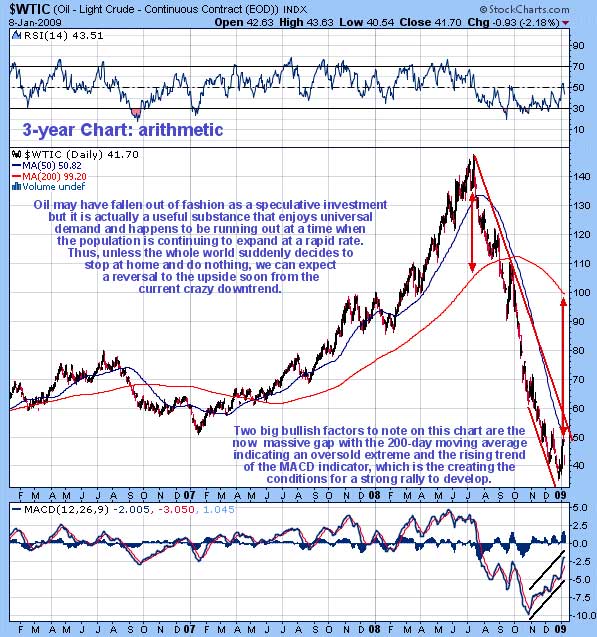
As we know from experience, oil stocks generally lead the oil price. This was the case back in the Summer when the oil stock indices topped out in May, about 6 weeks ahead of the oil price itself. It is thus interesting to observe that oil stock prices stopped declining way back in October after a violent plunge and entered a large trading range, as we can see on the 1-year chart for the OIX oil index, bounded between about 480 and 630. In recent weeks stocks have been firming up as shown by the OIX index gravitating towards the top of this trading range, with a series of higher lows, so that the 50-day moving average has turned up. This has created the conditions for an upside breakout above the first resistance level, and the index made a premature attempt to break out above this resistance early this week before slipping back into pattern, but remains in position to stage an upside breakout shortly. 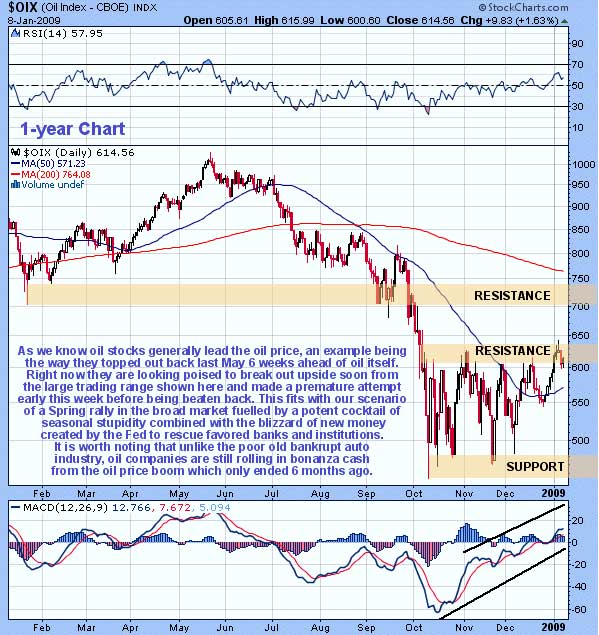 Fundamentally the reasons for a new uptrend in the oil sector soon are believed to be as follows: a rally in the broad stockmarket through to about May looks likely, which would be due to the usual seasonal improvement in sentiment. Sentiment is about at rock bottom right now, so it is not so hard to imagine. Such a rally would be fuelled by the blizzard of new money created by the Fed to bail out favored banks and institutions working its way through the system. These massive increases in the money supply will later on lead to rampant inflation and a collapsing dollar. A crucial background factor that must come to the fore again with the passage of time is Peak Oil - oil is running out, and this fact combined with a continually rising population wanting ever more and more must conspire to drive up the price of the single most important commodity in the world. Clive Maund January 11, 2009 support@clivemaund.com Clive Maund is an English technical analyst, holding a diploma from the Society of Technical Analysts, Cambridge and lives in The Lake District, Chile. Visit his subscription website at clivemaund.com .[You can subscribe here]. Clivemaund.com is dedicated to serious investors and traders in the precious metals and energy sectors. I offer my no nonsense, premium analysis to subscribers. Our project is 100% subscriber supported. We take no advertising or incentives from the companies we cover. If you are serious about making some real profits, this site is for you! Happy trading. No responsibility can be accepted for losses that may result as a consequence of trading on the basis of this analysis. Copyright © 2003-2008 CliveMaund. All Rights Reserved. |
| Home :: Archives :: Contact |
MONDAY EDITION June 8th, 2026 © 2026 321energy.com |
|