|
FRIDAY EDITION February 13th, 2026 |
|
Home :: Archives :: Contact |
 |
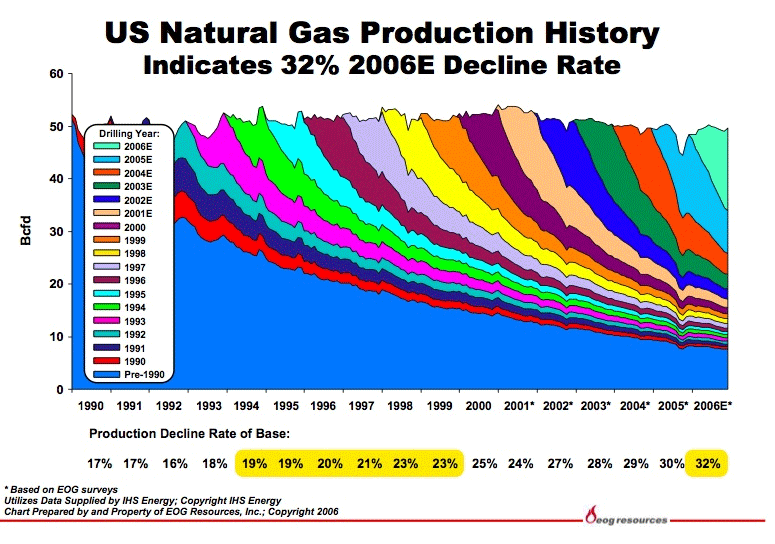
The Big Picture for North American Natural GasJim LetourneauJune 21, 2007 www.bigpicturespeculator.com The graph below prepared by EOG Resources (using data provided by IHS Energy) illustrates the most important thing you need to know about the North American natural gas market. Decline rates of gas wells have almost doubled over the last 10 years! Natural gas wells normally produce at their highest rates as soon as they are put into production. Over time the gas flow rates decrease until the revenue stream from the gas production is less than the cost required to maintain production. This is when the wells are shut in or abandoned. The slope of each line on the graph represents the decline rate. A new natural gas well that produced 1 million cubic feet of natural gas per day (1 MMCF/D) on January 1, 1990 would produce .83 MMCF/D on January 1, 1991. While this well would likely produce natural gas for many decades, each successive year will see less production than the previous one. The greatest declines in natural gas wells typically occur during the first year and then they decrease to a few percent a year. This is illustrated by the ever decreasing slope of the production lines from left to right on the graph. What is important to realize is that a natural gas well drilled on January 1, 2007 producing 1 MMCF/D will be producing only .68 MMCF/D on January 1, 2008. Increasing decline rates are the direct result of advances in petroleum engineering. Natural gas wells are drilled using methods that cause less damage to the gas bearing reservoir. Then the wells are "fracced", a method that creates fractures in the rock allowing more gas to flow in to the wellbore. Many of today's natural gas wells wouldn't flow any gas at all using drilling techniques from the 1960's. In other words, we can drain the natural gas out of the reservoir in less time using modern technology. The constructive aspect of increasing decline rates is that exploration companies can recover their costs more quickly allowing them to reinvest their capital into more drilling. Unfortunately when drilling costs increase significantly or the natural gas prices are low, exploration activity naturally decreases. When decline rates were lower, it was relatively easy to "catch up" and create new natural gas supplies to replace production. The current situation where natural gas price declines are higher creates an "exploration treadmill" where more drilling is required to maintain current production levels. We are coming off of a period of low natural gas prices and lowered exploration budgets. A small increase in natural gas demand will create a volatile situation where prices spike and the industry struggles to replace natural gas reserves that are declining at ever increasing rates. Other factors that weight heavily on the natural gas supply picture include an increasing reliance on unconventional natural gas sources and the trend towards lower natural gas production per well. 
Jim Letourneau June 21, 2007 www.bigpicturespeculator.com |
| Home :: Archives :: Contact |
FRIDAY EDITION February 13th, 2026 © 2026 321energy.com |
|