|
TUESDAY EDITION June 9th, 2026 |
|
Home :: Archives :: Contact |
|
|
The Price Of Oil: Who Gets Hurt?
Ronald R. Cooke Significant Cultural Change AheadDisclaimer - Putting together the research for this essay has not been an easy task. One can not take available data at face value. Some of the data is unavailable. Much of it is untrustworthy. I was thus forced to make many estimates and assumptions. Because of these challenges, the content of this essay can only be taken as indicative of broad trends. The content, charts, tables, statements, comments, conclusions, and forecasts found in this essay are presented without any warranty. IntroductionMy wife and I were shopping for groceries at our local supermarket. We overheard a woman tell her little boy: “Now that’s all we have to spend here. We still need to buy gas to get home.” I wonder how many time a day this same scenario plays out. Food or gas. Food or rent. Perhaps if our people in Washington spent more time at the checkout counter, they would have a gut level sensitivity to the inflationary spiral currently driving food and fuel prices.
The IssueWe hear consumers have less money to spend on food, clothing, housing, and discretionary items because the price of oil has risen to ~ $99 per barrel on world markets. That translates into higher prices for gasoline, diesel, kerosene, propane, and heating oil fuels as well as thousands of other products that are either made from oil, or use oil in the production and distribution of finished goods. Of particular concern is the impact of higher oil prices on the cost of food. The USDA tells us that in 2009, about 14.7% of American households had either low food security (need financial help to cope with food prices) or very low food security (one or members of the household occasionally do not get enough to eat). The Law of Unequal Distribution states there will be an unequal distribution of economic change among the economy's participants. Although there are several different ways to classify people in order to make comparisons, the most common measure of economic change is money. Oil prices are a particularly good illustration of this law because higher oil prices have a serious impact on lower income households. They will pay a higher percentage of their income to purchase products made from oil. But will they really be hurt? Can the effect be quantified? And what is the potential social outcome? Intrepid analyst that I am, I plunged into this project with a grim determination. I fired up my trusty spread sheet and diligently searched the WEB for answers. What follows are some observations on the price of products made from oil, and how these costs affect the American consumer. We want to know: How will rising oil prices will impact the finances and lifestyle of American households?
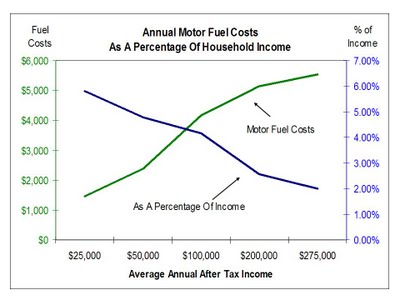
Motor FuelsWe start with a determination of how much these households are likely to spend on gasoline or diesel motor fuel, assuming they drive an average of 11,000 miles per year. There are approximately 116,500,000 households in the United States. (Note 1) Of these, approximately 79.5 million are family households, and 37 million are classified as “non-family” households. About 92 % of all households (107,180,000 units) have at least one vehicle. Research into the average number of vehicles per household, the average miles traveled for each vehicle, and the probable average fuel economy per vehicle, yields the conclusion that Americans will use an average of 838 gallons of motor fuel worth $3,160 per household in 2011. (Note 2) Estimated annual motor fuel costs, versus percentage of household income, are shown for 2011 in the following graph. Households with an annual disposable income of $25,000 have an average of 1.05 vehicles per household, and consume an estimated 385 gallons of motor fuel worth $1,451 per household. That’s just under 6% of household income. Households with an annual income of $50,000 have an average of 1.49 vehicles per household, and consume an estimated 636 gallons of motor fuel worth $2,397 per household. That’s almost 5% of household income. By contrast, households with an income of $275,000 or more have an average of 3.21 vehicles per household, and consume an estimated 1,468 gallons of motor fuel worth $5,535 per household. That is, however, just 2% of household income.
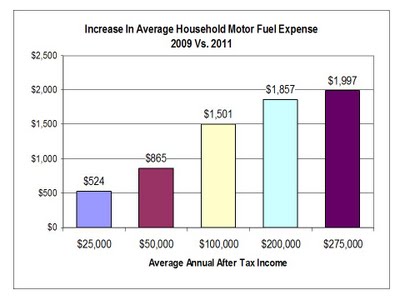
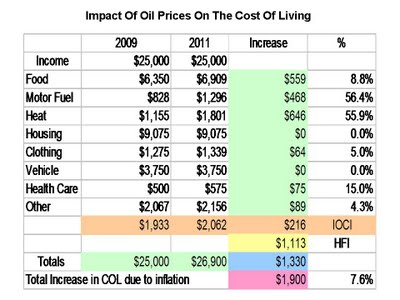
The Hypothetical FamilyLet’s compare how the price of oil affects a family of four that has a disposable income of $25,000 per year, one older vehicle that gets 32 Mpg, and uses either propane or heating oil for household heat. In doing this analysis, we recognize the costs for individual line items can vary widely by household. Taken as a whole, however, these estimated average costs appear to be reasonable for all households in this income bracket. Column 1 in the following Table lists the individual line items. Motor fuel includes diesel or gasoline products. Heat costs are an average of propane or heating oil costs for this type of household. Column 2 shows household costs incurred in 2009. Column 3 shows estimated comparable line item costs for 2011. Column 4 shows the incremental costs for each line item for 2011 versus 2009, and Column 5 shows the percentage increase over this two year period.
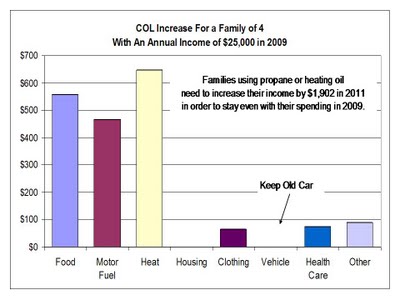
Our family will spend $2,062 in 2011 on indirect oil costs. These costs are hidden from the consumer because they are included in the price of the product. Examples can be found in products made from refined oil, processed using refined oil, or transported by fuels made from oil. The largest factor is the role oil products play in the cultivation, production, processing, packaging and distribution of food. Indirect oil costs (IOC) for our hypothetical family will increase by an estimated $216 from 2009 through 2011. Direct oil costs for heat and vehicle fuels (HFI) consumed by our hypothetical family, will increase by an estimated $1,113 from 2009 through 2011. Indirect oil costs, plus oil fuel costs, increase by a total of $1,330. Inflation has increased our hypothetical family’s cost of living by a total of $1,900 (7.6%) from 2009 through 2011. It should be noted that the price of oil has indirectly or directly accounted for 70% of this increase in the cost of living. The following graph shows the impact of food and fuel prices on our hypothetical lower income family.
If oil increases to a consistent price of $124 per barrel, then they will spend over $6,400 (24%) of their disposable income on oil products in order to maintain their mobile lifestyle. But is this really realistic? At what point does the cost of owning a vehicle become prohibitive? When does money for food, housing, clothing and other necessities preclude a continuation of personal mobility? It should also be noted that the federal government’s poverty threshold in 2011 is officially $22,350. Based on this analysis of the cost-of-living, if oil consistently sells for $99 per barrel, then the poverty threshold is realistically $24,250. That’s ~$1,900 more than the official peg. And what about households that use electricity, natural gas, wood, or coal for household heat? As we shall see later on in this essay, they are in better shape financially.... but not by much.
Who Gets Hurt?But wait. Do we know anyone else who is trying to get by on $25,000 or less per year? How about people on Social Security? There is nothing hypothetical about these households. This is reality. Over 10 million Social Security and railroad retirement recipient households have incomes of $25,000 or less. Individuals and couples. Living on retirement benefits and whatever else they may be able to scrape together for income. Here is the official story. In 2009, the Obama Social Security Administration told all Social Security recipients: “”When there is a period of no inflation, the law does not permit an increase in benefits. Based on the Consumer Price Index (CPI) published by the Department of Labor, there was no rise in the cost of living during the past year, so your benefit will remain the same in 2010.” Then in 2010, the Obama Social Security Administration told all Social Security recipients: “The government measures changes in the cost of living through the Department of Labor’s Consumer Price Index (CPI). The CPI has not risen since the last cost-of-living adjustment was determined in 2008. As a result, your benefits will not increase in 2011”. Here is the truth. Increases in Social Security benefits always come after increases in the cost of living. Furthermore, the Department of Labor (DOL) typically underestimates the rate of inflation. The official CPI-U NSA increased by 2.6% in 2009, and 1.4% in 2010. In 2011 it is likely to increase by 3.6% (or more). That’s a 7.6% increase in the rate of inflation. If Social Security recipients needed $25,000 to survive in 2009, then their cost of living will increase between $1,700 and $2,000 in 2011. Over 10 million retirement households are struggling with declining real income.
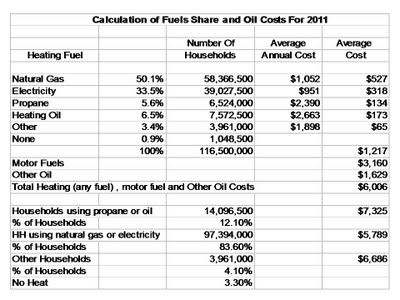
Total Oil Related Expense Per HouseholdVehicle fuels are only part of the oil price inflation story. America’s 116,500,000 households heat their homes with natural gas (50.1%), electricity (33.5%), heating oil (6.5%), propane (5.6%), and other fuels such as wood, coal, and kerosene (3.4%). Approximately .9% of these households do not have a primary source of heat. Assuming the average world price for a barrel of oil is $99 for 2011, we can calculate the national average annual oil consumption cost per household by type of heating. In the following Table, Column 1 lists the type of fuel used for household heat. Column 2 shows the percentage of households that use each type of heat (or do not have any heat). Column 3 lists the number of households by type of heat. Column 4 shows the average annual cost per household, and Column 5 calculates the average cost by type of heat for all households with heat. The average annual cost of fuels used for household heat is $1,217. Total heat, motor fuel and other oil products and services cost – on average - $6,006 per household. But households using propane or heating oil (~ 12.1% of all households) will spend far more than the average – about $7,325. Households with electric or natural gas heat, (~ 83.6% of all households) will spend less – about $5,699. Households that use wood, coal, or other fuels (about 3.4% of all households) will spend about $6,700. About .9% of all households either have no heat or only use supplemental heat (an electric room space heater, for example). Space heating costs for electric households are less because electricity delivers a lower average cost per BTU of useful heat, and because these households tend to be located in warmer regions of the United States. Recent domestic drilling activity has reduced the potential cost of natural gas.
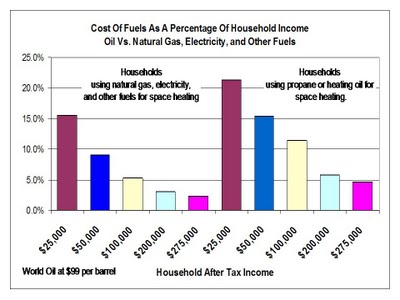
Oil Expense as a Percentage of IncomeBut at what point are households forced to alter their lifestyle because they can no longer afford the price of oil products they purchase? In the following charts, we use household incomes of $25,000, $37,500, $50,000 and $100,000 for this analysis. Most welfare and Social Security recipients fall within the two lower income levels. According to census data, approximately 49% of American households (~57,000 units) have incomes of $50,000 or less. (Note 2) In this analysis, we calculate the average number of vehicles per household, the typical miles per gallon each vehicle gets, the number of gallons of gasoline or diesel motor fuel each household consumes, the cost to heat the household, and the cost of other oil products and services the household consumes. In addition to heat and vehicle fuels, households will directly purchase high oil content products (motor oil, plastics, lubricants, fertilizers, chemicals, etc.), and indirectly purchase low oil content products and services (where oil products are used in a manufacturing process, agriculture, or the provision of a service). It would appear that if a household is forced to spend more than 20% to 25% of its disposable income on oil products, then it will eventually be forced to alter its lifestyle. It is highly likely oil product consumption will decline if income divided by the household’s cost of living is less than 1 for an extended period of time. As we have seen in our budget analysis, households have to set aside a substantial portion of their income for housing, food, clothing, and other necessities.
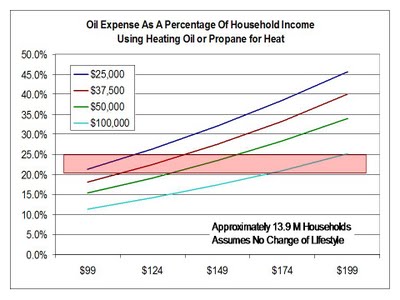
Households with Propane or Heating Oil.In 2009, when oil averaged $62 a barrel, there was a moderate pressure on households with $25,000 of disposable income to alter their lifestyle. At $99 per barrel, however, households that use propane or heating oil for space heating and hot water will have entered the “red zone”. They will purchase an average of 1,475 gallons of oil products worth approximately $5,315. Direct and indirect oil costs devour ~21% of household income. At $124 a barrel, the price of oil will force households with a disposable income of $37,500 into the red zone, followed by households with $50,000 of disposable income if oil reaches a consistent $149 dollars per barrel, and households with $100,000 of disposable income if oil is a consistent $174 per barrel. Vehicle ownership will decline, especially among households that have less than $50,000 of disposable income, because that’s the most obvious oil related expense to cut. They drive fewer miles per year, purchase fuel efficient vehicles, and drive their vehicles until they literally “fall apart”. In order to reduce their oil costs, many of these households will also be forced to skimp on heat and hot water.
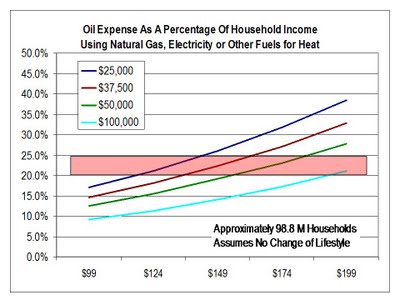
Households with Natural Gas, Electricity or Other Fuels for HeatThe projected pressure on household finances is somewhat less if a household uses natural gas, electricity, wood, coal, or other (non-oil) forms of heat. Households with disposable incomes of $25,000 will have entered the “red zone” by the time oil reaches $124 per barrel. Households with an annual disposable income of $37,500 will have entered the red zone by the time oil reaches $149 per barrel, followed by households with a disposable income of $50,000 at $174 per barrel, and households with a disposable income of $100,000 at $199 per barrel.
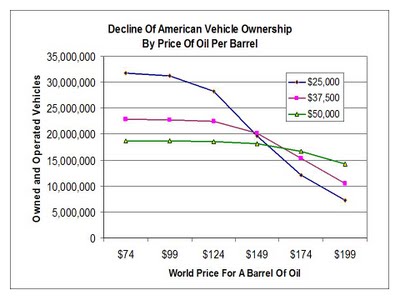
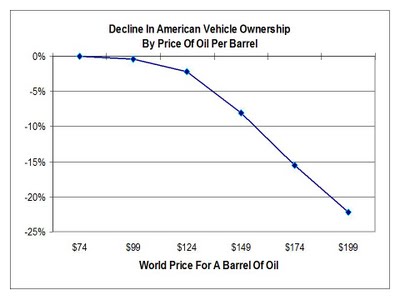
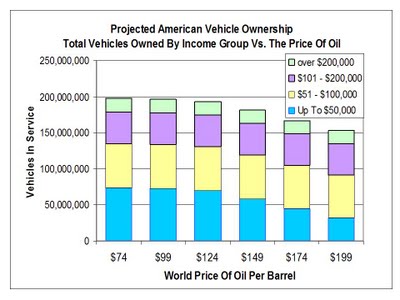
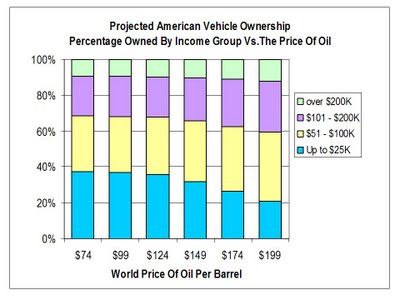
Vehicle OwnershipLet’s see if we can quantify how the price of oil affects the size and characteristics of the American motor vehicle market. Using the basic data described above, we can develop a profile of probable light vehicle ownership at different oil price points. For this analysis we add together the average the cost of household heat, motor fuels, direct oil product consumption, and indirect oil product consumption, across all households for each income level, and plot vehicle ownership by the price of oil per barrel in $25.00 increments starting at $74 per barrel. As the price of oil increases, families and individuals are forced to spend a greater percentage of their income on oil products. This decreases available funds to purchase and operate a motor vehicle. As the price for a barrel of oil increases from $99 to $199, projected vehicle ownership among lower income groups declines rather quickly. Although the decline in vehicle ownership does not occur immediately, it would appear lower income consumers will eventually be forced out of the light vehicle market. In the following graph, we show this trend for households that have an annual income of $25,000 $37.500, and $50,000.
Implications Of Higher Oil PricesThe availability and price of oil has serious cultural and economic implications. At least 25% of American households are currently being forced to alter their lifestyle. At $199 per barrel, this percentage increases to at least 67% of households.
CulturalIn Winter, lower income households are forced to choose. Fuel for heat and hot water, or fuel for the car? Food for the table or fuel for the furnace? As oil prices increase, these choices will become more difficult – and depressing. There isn’t enough money. It becomes a challenge to find enough cash to pay for household heat. In some communities, public and private groups help households that consume oil products for heat by contributing to the purchase of heating oil, propane or kerosene. A few precious gallons at a time. Although households that use natural gas, electricity or other fuels for heat, are currently under less financial pressure, they will also be forced to alter their lifestyle as oil prices increase. The freedom of personal transportation has long been a fixture of American life. For lower income households, however, this freedom is being curtailed. As the price of oil increases beyond $99 per barrel, the stress of this change will become ever more evident. Vehicle operating costs – including fuel, purchase costs, maintenance costs, insurance and fees - become prohibitive. Oil costs also push up the purchase price of other goods and services. Vehicle ownership will decline. Vehicle miles traveled will decline. Households become more dependent on the local community. It will take longer and be more difficult to commute to work. Declining mobility forces workers to move closer to the place of their employment, even if it means moving into a less desirable neighborhood. Many households living on Social Security can not function without local a public transportation option. Lower income households will need locally available shopping, medical, dental, banking and other services. Local and State governments will have to rethink the placement and staffing of schools, clinics, and public safety facilities. Retailers will reorganize the distribution of food and other goods. Think about it. If many of your customers must struggle, or are unable, to come to your place of business, what do you do? Personal mobility creates the perception of social equality. The decline of personal mobility will be psychologically painful and socially demoralizing. How many Americans live in substandard housing, but are proud owners of a vehicle? Without a personal vehicle, one feels trapped.... helpless. Expect increasing social discontent and anger as higher oil prices exacerbate the financial divide between upper and lower income groups.
EconomicIt should not be a surprise that most of the economic impact relates to the means of transportation. Moving people and goods. Distribution of products and services. Economies of scale will become far more important. Railroads or highways? Airplane or train? Trucks or containers? Cost per mile of travel. Weight per dollar per mile of travel. Fuel efficiency. Busses and share ride vans are a growth industry. Assume an increased demand for shopping services that bring groceries and other products from the store to your home. Aside from occasionally begging a ride with someone else, higher oil prices will force a segment of lower income groups into public transportation. It’s either that or don’t go. Sure. We are experiencing an intermediate period where lower income people keep their old vehicle until it dies, or make the stretch to purchase an inexpensive (probably used) vehicle that gets great gas mileage. That trend is already in place. But as we have shown in the text and graphs above, the American vehicle market will gradually favor cars, trucks, SUVs, and vans that appeal to the more affluent because these are the only households that can afford the cost of fuels. In a nation without enough cheap energy, GDP has to deteriorate. Without assertive and competent government planning, unemployment will increase. Limited mobility makes the daily commute to work an arduous task. Higher energy costs limit business activity. Higher oil prices also translate into higher rates of inflation, especially for the current consumption of food, fuels, clothing, and so on. Despite gradual gains afforded by increases in energy efficiency and “green” energy, America’s economic fortunes are inexorably tied to the availability and price of cheap oil, natural gas, coal, and nuclear power. The disappearance of low cost energy will definitely damage America’s economy.
GovernmentUnfortunately, America does not have a credible energy policy. It does not have a proactive energy exploration, production, and distribution strategy. Government is not focused on the need for cheap energy. Instead, America has a patchwork of politically correct Federal and State energy measures that guarantee Americans will pay higher prices for gasoline, diesel, propane, kerosene, heating oil, and jet fuel. Public policy also favors higher prices for electricity, thus increasing the cost of electric heat and making electric vehicles less attractive as a transportation option. Federal and State regulation continues to increase the cost of operating of natural gas, nuclear, coal and hydroelectric generation facilities, thus making electric heat more expensive. It would appear our political system is determined to place limits on the supply of affordable energy. For the American consumer, the cost of current consumption (including food and fuels) will go up. That’s called inflation. America does not have a credible public transportation policy. Although politicians routinely give this subject the appropriate amount of lip service, the United States does not have a comprehensive strategy for the funding, construction, maintenance, and operation of public transit lines and terminals. Railroad infrastructure and operation has been largely ignored. The integration of public and private systems needs far more proactive attention. The United States will have an energy crisis because there is no plan to satisfy America’s need for lower cost fuels. America’s politicians don’t even have the will power to address the issue. Furthermore, if there is an acceleration of oil prices, then welfare and entitlement costs, along with a decline of GDP, will devastate Federal and State budgets. It does not matter. Republican, democrat, socialist or conservative. There will not be enough money to fund the promises of America’s political establishment.
The Bottom LineAs the price of motor fuels and household heat go up, expect a growing dissatisfaction, frustration and anger with Federal and State politicians who have failed to develop an adequate response to the fuels and mobility needs of lower income households. And the old political solutions may not work. America can not afford the cost of a meaningful personal transportation subsidy, nor can it pay enough welfare to compensate for the dramatic effect of higher oil prices. The Law of Unequal Distribution shows us that households with a disposable income of less than $50,000 (~ 49% of American households) will be forced to make serious adjustments to their spending on personal transportation in order to balance the budget. But there is a thin line between having enough cash to buy fuel, and not having enough money to survive from one paycheck to the next. The official rate of inflation masks the real world costs of current consumption because for the last three years they have been lumped with declining asset values to calculate the total rate of inflation. It gets worse. Since existing government policy favors increasing the cost of coal, oil, natural gas, nuclear energy, hydropower, and green energy, there is no upper limit to the inflationary impact of these policies. How soon will fuel prices become a serious political issue? When does constant exposure to frigid temperatures lead to illness? Frustration? Anger? Where is the breakpoint of rebellion? Which political theology will be the most appealing? Which political system is most likely to provide a practical solution? Speculation and shortages will push up the price of oil. Speculation and surpluses will drive the price down. But the impact of oil depletion guarantees that the long term price trend is UP. Obviously something has to give. The consumer will have to make choices. Shoes for the kids or gasoline for the car? Meat on the table or fuel for heat? Make an impulse purchase at Wal-Mart or pay the rent? It's going to be rough. The folks are not happy.
Ronald R. Cooke Note 1: Identifying the number of households is a bit tricky. U. S. Census American Fact Finder data 2005 – 2009 enumerates 112,611,029 households, but indicates the actual number of households can be found in the population survey. The U. S. Census 2009 population data estimates there are almost 130 million housing units, but not all units are occupied. The USDA estimates over 118 million households. I calculated my estimate of 116,500,000 by analyzing the contraction of households caused by unemployment and underemployment. The kids are moving back in with Mom and Dad. Multiple persons are sharing a single household. Note 2: Please note. We are only counting households that have at least one vehicle for personal use, or personal and commercial use (as one would expect of real estate agents, trades people, and so on). In addition, we need to remember most households currently have more than one vehicle. Note 3: For this analysis, light vehicles are defined as household passenger cars, SUVs, passenger vans, and pickup trucks with 2 axels and 4 tires that can be used for passenger transportation. Excludes commercial vehicles. Many vehicle estimates are poorly defined and may include motor cycles, motor homes and/or freight trucks. As a result, one can find higher numbers of vehicles in other estimates. Oil Price Inflation: The Data Problem Analyzing consumer spending on oil based energy products (as distinguished from common household energy products such as electricity, natural gas, coal and wood) has been a challenge. For example: most homes use more than one fuel for cooking, laundry, heat and hot water. Although surveys have been taken in an attempt to separate fuel use by volume, they tend to limited in scope, and are more likely to reflect the consumer’s opinion than actual fact. There is a conspicuous inconsistency of data definitions among the surveys and tabulations of consumer data. What, for example, is a light vehicle? Does that include motorcycles and Scooters? Golf carts? And how does one differentiate between personal versus commercial vehicles? And how do we count personal vehicles that are also used for commercial purposes? Increased oil prices will have a marginal impact on organizations that use relatively little oil in the provision of goods and services. We can anticipate financial service, insurance, health care, education, government (excluding military and transportation services), and utility enterprises will experience modest cost inflation as the price of oil increases. On the other hand – depending on their business model - transportation, retail, wholesale, agriculture, construction, and manufacturing enterprises may experience modest to sharply increased cost inflation. These costs, less gains in oil consumption efficiency and changes to the basic business model, will eventually have to be passed on to the ultimate consumer. Based on these challenges, it has been necessary to estimate certain data points. Although they appear to be reasonable, there can be no assurance as to their accuracy. All dollar estimates are in 2011 dollars, and exclude the effect of other forms of inflation. Oil Price Inflation: Sources The data for this essay has been researched from the U.S. Department of Labor, Bureau of Labor Statistics; U. S. Department of Commerce, Census Bureau, U. S. Department of Transportation, Federal Highway Administration; U. S. Library of Congress; U. S. Department of Agriculture; and various private institutions. |
| Home :: Archives :: Contact |
TUESDAY EDITION June 9th, 2026 © 2026 321energy.com |
|