|
TUESDAY EDITION June 9th, 2026 |
|
Home :: Archives :: Contact |
|
|
Long Term Trends in the Resource Sectors of Energy and GoldJack Chan Years ago (30 to be exact) when I began buying stocks, the only source to check how the portfolio was doing was to read the weekend financial section of the newspaper. Back in those days, short term meant a few months. Today, with the help of internet and many new portable devices, short term means a few hours. By trying to achieve a higher return in a shorter time frame, we become frequent traders, and focus primarily on the day to day volatility. By doing so, we are exposed to the short term fluctuations of the markets, and in order to manage risk, our stops are tight and therefore, often result in whipsaws during a sideways market, which is about 50% of the time. We must accept that if we endeavor ourselves walking such a tight rope. The alternative would be to ignore the short term, and only invest in the long term trends of the markets, or if you are like me, try to combine the two by trading some short term and hold a core position according to the longer term. Problem is, unless you enter on a fresh long term buy signal, chances are good that you may get whipsawed a few times trying to board that moving train. The resource sectors of energy and gold are prime example as we are now at what appears to be the beginning of a long term downtrend. Do not confuse this new downtrend as a beginning of a bear market, because as long as the 50ema is above the 200ema, we are in a long term bullish configuration.
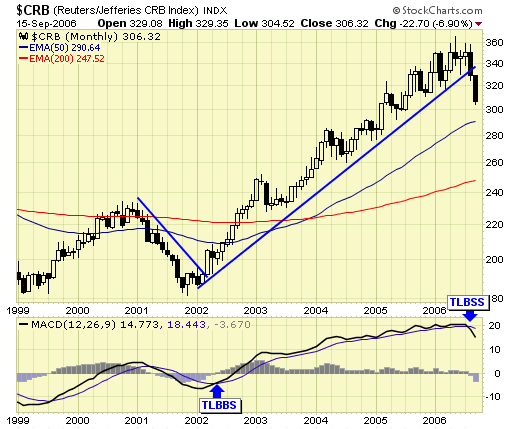
First, we look at the $CRB index. We now have a sell signal, ending the buy signal since early 2002. The five year up trend is now over and a new down trend is in progress. With the bullish config, this is a major correction within a bull market, a first such correction since this commodity bull market began in 2002.
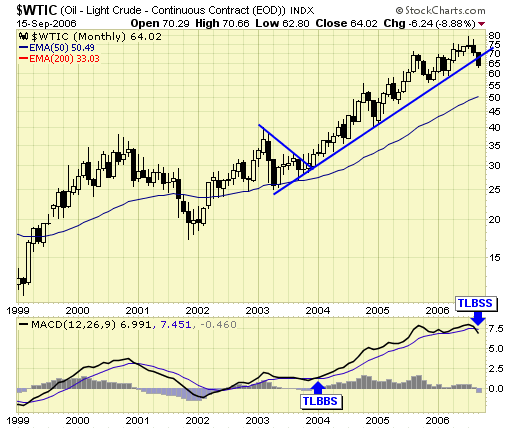
Crude oil – a big component of the CRB index, also gave us a sell signal this month, ending the buy signal from late 2003. Because this is a monthly chart, it cannot be confirmed until the month is over.
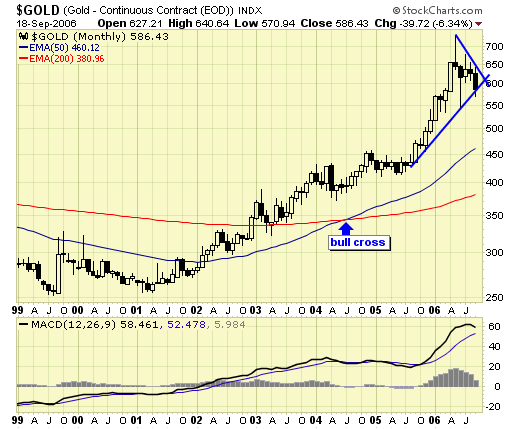
Gold – is trying very hard to hang in there, currently testing support, and we need to see a monthly close above TL support to keep the uptrend alive. A major correction is due and could drop prices back to between $430 and $485. Seems harsh doesn’t it? Then again, gold was at $150 higher just four months ago…….We cannot see it on a monthly chart, but the “Katrina gap” is at $430 and remains unfilled.
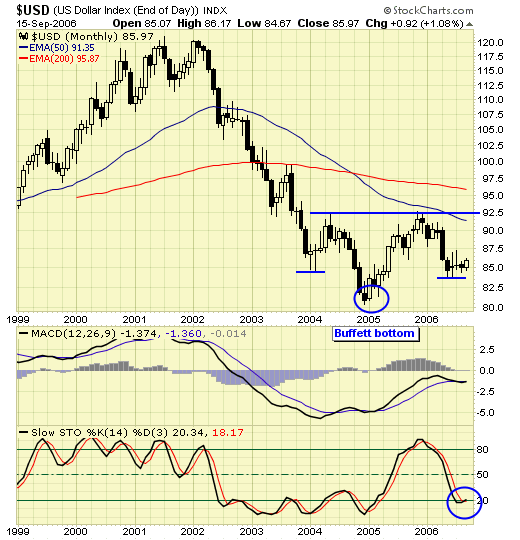
USD – often has an inversed relationship with things of value, is currently in the process of completing an inverted “head & shoulder” bottom. I circled the Dec 2004 low as the “Buffett bottom”, referring to Warren Buffett’s public trashing of the dollar in January 2005, when he announced that both him and Bill Gates were investing heavily in the Euro in anticipation of the collapse of the dollar. Confessing always that he is not a market timer, perhaps he is a few years early or a few years late. The only hint that this inverted head and shoulder bottom may become reality is the stochastics have become oversold, because a pattern like this cannot be confirmed until the neckline is breached, and we are long way from that.
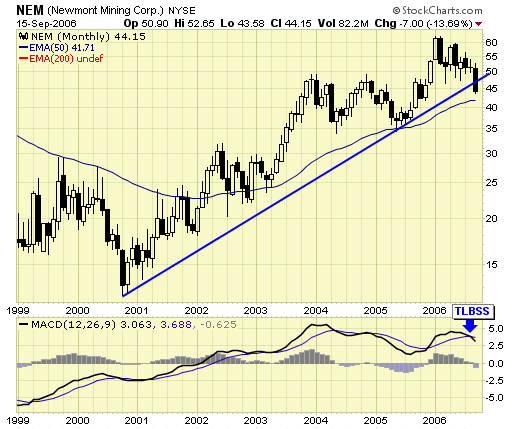
Newmont – not a pretty chart for gold bugs. The six year uptrend is violated and we have a sell signal on this gold giant. NEM is to the gold sector what Intel is to the chips sector. A major correction could see a retracement to the $30 to $35 area. What is significant about the breakdown in NEM is because its heavy weighting within the $HUI and $XAU which are the indexes all traders watch. A breakdown in NEM should lead to a breakdown in both indexes.
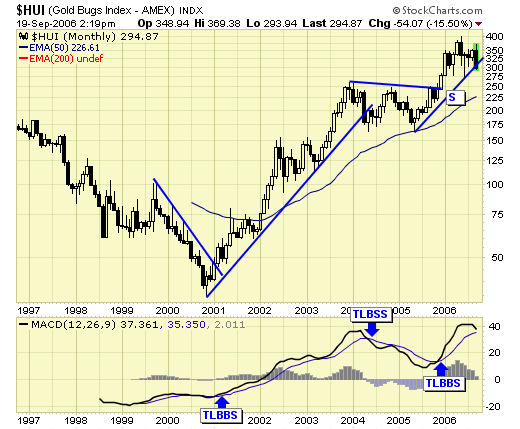
$HUI – prices are currently testing TL support, and we need to see a monthly close above support to remain bullish and continue to hold our core positions.
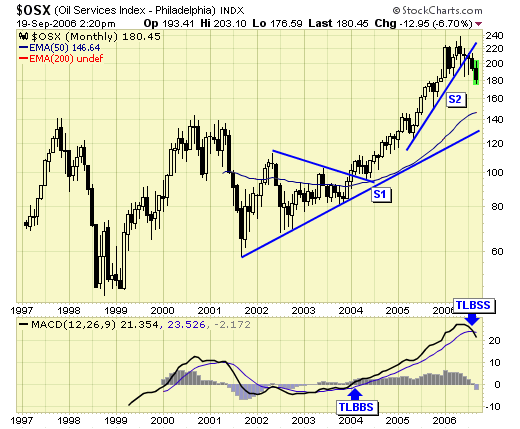
$OSX – the energy sector is already on a sell signal and we have no open positions. The best is yet to come The long term picture for the resource sectors of energy and gold is quite clear. We are at the beginning of a major correction which could take months to complete. A corrective phase is much more difficult and challenging to traders than an impulsive phase because price action within a major correction is often “zigzag”, overlapping with sharp rallies and sharp declines, unlike a rising trend which allows you to “ride” it. Add to the fact that many investors are unwaveringly bullish and will buy the dips thus providing more power to the short covering rallies. This new trading environment will be different than what we are used to in the past few years, and may require some adjustment. Our job as traders must adapt and change as market dynamics change. My job is to recognize these subtle changes quickly, and provide better entries and exits, using the tools I have. Most importantly, we must manage our risks and preserve capital, because, the best is yet to come...
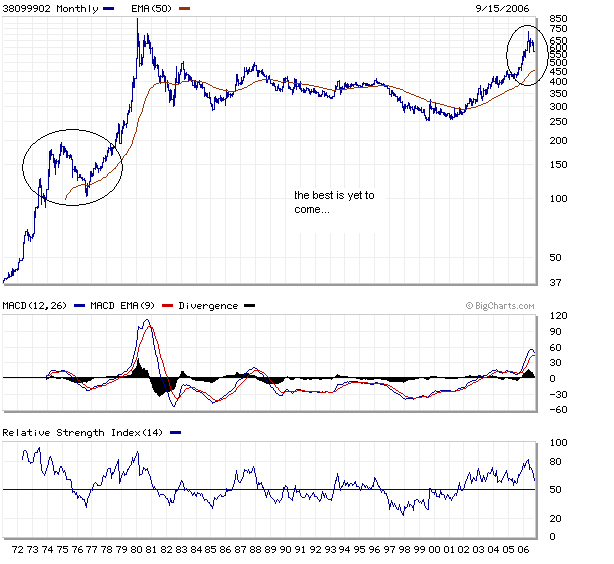
Knowing and seeing the big picture is a must if we were to survive in this game. The last gold bull market began in the early 70s, and it did not go straight up either. In fact, a major correction took place between 75 & 76 which retraced about 50% of the gain before the parabolic rise to $800. A similar correction will drop gold back to the $400s before the real thing begins. Folks, an opportunity of a lifetime is ahead of us, do not let the current correction worry you. Those who are patient and manage their money well in the months ahead will be in an excellent position when this correction completes. Those who are stuck in the short term will lose money trying to pick the bottom and will become frustrated, and may end up leaving the market thus missing the biggest party of all.
September 20th, 2006 |
| Home :: Archives :: Contact |
TUESDAY EDITION June 9th, 2026 © 2026 321energy.com |
|