|
WEDNESDAY EDITION July 8th, 2026 |
|
Home :: Archives :: Contact |
|
|
Crude oil to $100?By Jack Chan at www.simplyprofits.org July 18th, 2006 With violence escalating in the Mideast, crude oil is spiking up. Analysts are now stepping over each other to up their price target to $100 and beyond. As a technician, I have no opinions to offer you as to why this and why that, there are plenty if look around. My focus is on price action, the simplest and possibly the best indicator there is.
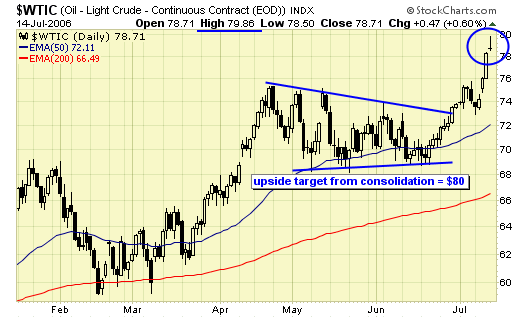
Crude oil – price target from the consolidation is $80, which was achieved on 7/14. The doji candlestick may indeed be the top.
This COT chart data ends on 7/11, therefore, both OI and spec longs should be higher because price of crude oil shot up $6 in the past three days. However, the bearish divergence still exists, since higher prices are not supported by higher OI and speculators’ long positions. We’ll know for certain from next week’s COT data.
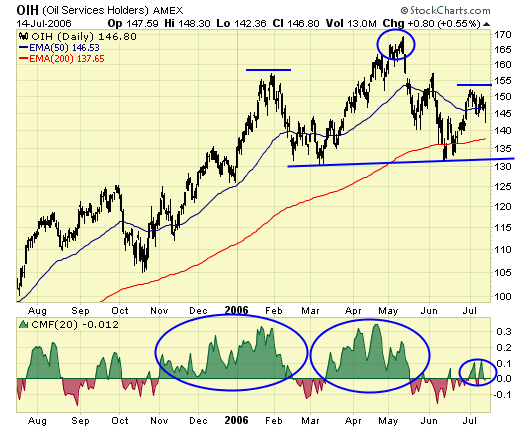
We trade energy ETFs and not crude oil. The fact that despite record high oil prices, OIH is trading at 17% below the May high, when crude oil was $75. The inability for OIH to push higher has resulted in a classic “head & shoulder” topping pattern, confirmed with a substantially lower money flow into the “right shoulder”.
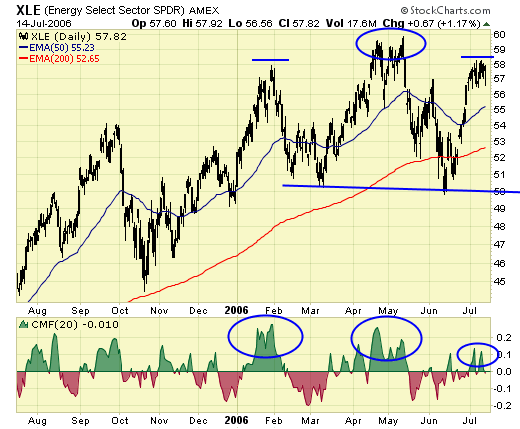
XLE – a little stronger than OIH, but almost an identical scenario.
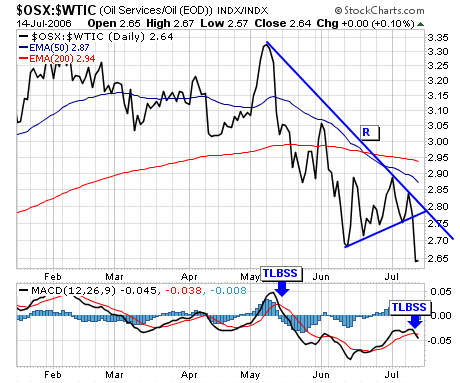
The ratio between the oil index and crude oil has now broken down, again. The breakdown in early May resulted in a nasty sell off in the energy sector, and if this indicator is correct, we should see another sharp sell off in the next few weeks.
Summary 07/18/2006 |
| Home :: Archives :: Contact |
WEDNESDAY EDITION July 8th, 2026 © 2026 321energy.com |
|