|
FRIDAY EDITION April 24th, 2026 |
|
Home :: Archives :: Contact |
|
|
XOI Index : Arca Oil & Gas Index Dr Thomas Chaize January 23rd, 2015 Email: dani2989@voila.fr www.dani2989.com The XOI, Arca Oil & gas Index is an index of the oil AMEX (American Stock Exchange), the New York Stock Exchange, created in 1984. It consists of 19 major oil companies (Exxon Mobil, Chevron, BP PetroChina, ConocoPhillips, Statoil, Petroleo Brasileiro, ...). Its acronym is: XOI. 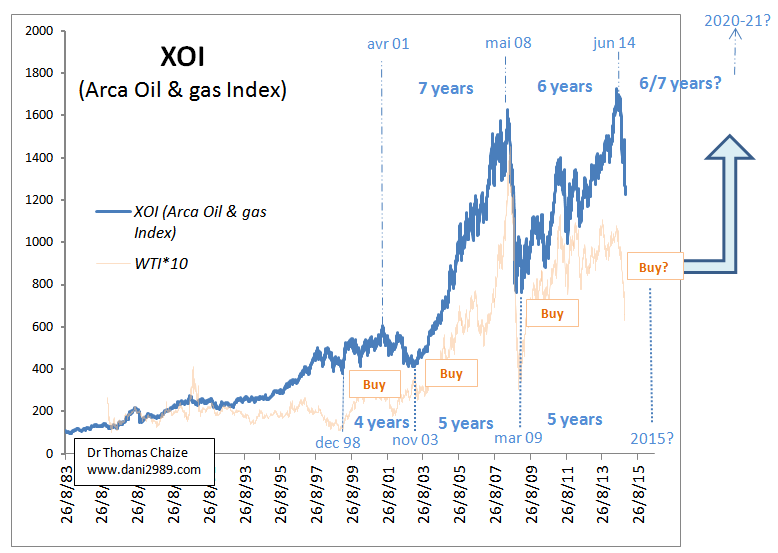
Since record low oil price in 1998, the XOI index has experienced three major cycles characterized by an increased index value followed by a decrease (the current decline is the 3rd one). The three up period can be explained by the growth in global demand and peak production of conventional oil (in short). The three down period can be explained as follows: It is difficult to know how far down the oil price and the XOI index will go. One could expect a price range between the current price and the lowest price of 2008. However if the XOI index keeps the same "tempo", it is likely that the decline will end in 2015 and then we will have the same investment opportunities during the year as of in1998, 2003 and 2009! I did not write an analysis in 1998, but in 2003 and 2009, I have already advised oil, I will do the same thing today! Comments: XOI is composed of major oil companies. They have capitalisations of tens of billions of dollars, or even of hundreds of billions. The XOI was more resilient to the decline in oil prices that many oil juniors. Some juniors are already valued today to a price below their (lowest) value in 2008, the value of their net assets and even their reserves of cash... Note : XOI is composed of major oil companies. They have capitalizations of tens of billions of dollars, or even of hundreds of billions. The XOI was more resilient to the decline in oil prices that many oil juniors. Some juniors have already today a price below their low of 2008, the value of their net assets and even their reserves of cash... Dr Thomas Chaize January 23rd, 2015 Email: dani2989@voila.fr www.dani2989.com This analysis is available for members of the mailing list free site Dr.Thomas Chaize. |
| Home :: Archives :: Contact |
FRIDAY EDITION April 24th, 2026 © 2026 321energy.com |
|