|
WEDNESDAY EDITION January 28th, 2026 |
|
Home :: Archives :: Contact |
 |
Not Just A SpikeJeff Rubin from Occasional Report #53, CIBC World Markets
April 15th, 2005
Over the next five years, crude prices will almost double, averaging close to $77/bbl and reaching as much as $100/bbl by 2010. That’s over twice the previous 6-year high (1980-1985) following the second OPEC oil shock, when crude, in today’s dollars, averaged the equivalent of $65/bbl. Tomorrow’s price hikes won’t be triggered by sudden supply disruptions like the Arab oil boycott of 1973 or the Iranian Revolution in 1979. Instead, they will follow from the inevitable collision between surging global crude demand and accelerating depletion of conventional crude supply. By 2010, prices will have to take out nearly 9 million barrels a day from world oil consumption—no mean feat for a world that has never been more thirsty for oil. As in the 1970s and early 1980s, energy will once again come to dominate both the economy and financial markets. But there are likely to be some fundamental differences. On the economic front, the impact of surging crude prices is likely to be far more deflationary than inflationary. During the 1970s, surging fuel costs were the catalyst for a huge outbreak of wage-price inflation, as workers futilely tried to protect the purchasing power of their incomes through ever-escalating wage demands. But that was in a world where most workers in G-7 economies were protected by huge trade barriers against competition from cheap offshore labour. In today’s world, where production and jobs can easily be shifted to low-wage economies, North American wages will have to eat energy price increases, and in the process, stomach the loss of purchasing power that comes along with it. Hence the implications for monetary policy couldn’t be more different than the ones posed by the OPEC shocks. Instead of draining the system of liquidity to starve out wage-price inflation, the primary concern of monetary policy in oil-importing economies like the US will be to support economic growth. Offsetting the massive terms of trade effect, and its taxing implications for both American consumers and American businesses, will require a much more accommodative posture than today’s Federal Reserve Board has so far acknowledged. On the financial market front, energy stocks will become almost as dominant in equity markets as tech stocks were in the last decade. As oil prices continue to rise, energy stock valuations, already characterized by some as a bubble, should follow a similar trajectory to the one they charted in the 1970s. Between 1973 and 1979, the oil and gas index of the TSX more than doubled. While long-term oil price expectations embedded in the oil strip curve have moved up sharply over the last three months, longdated contract prices for 2010 still show oil prices at only $50/bbl, half of what they are likely to be trading at by the end of the decade (see pages 2-6). The first two oil shocks were transitory, as political events encouraged oil producers to seize full sovereignty over their resources and temporarily restrict supply. This time around, with suppliers already running full tilt, there’s no tap that can suddenly be turned back on.
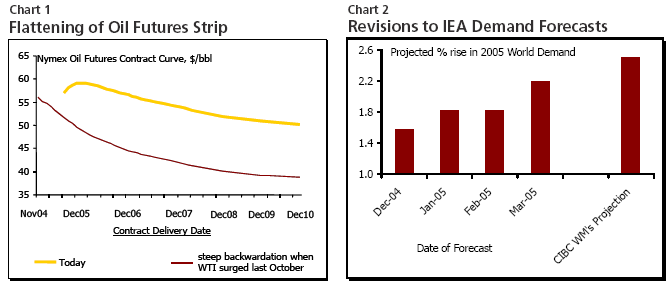
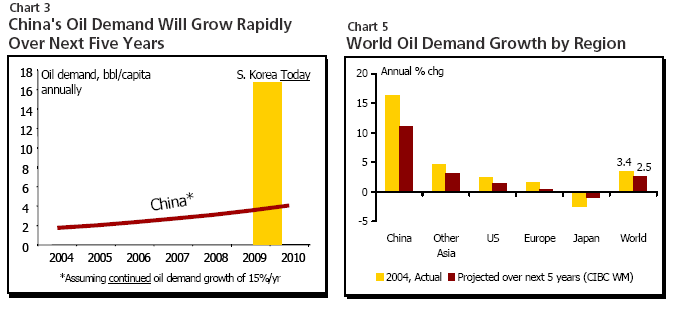
Crude Prices Will Almost Double Over Next Five Yearsby Jeff Rubin and Peter Buchanan Many oil “experts” were sure 2004’s high oil prices and hot demand growth was just an aberration. While the flattening of the futures curve suggests markets are now boosting their expectations for longer-term prices, they may still have a long way to go. Accelerating global demand concurrent with accelerating global depletion points to much higher energy prices over the next five years. In fact, the trajectory of future price hikes may even challenge the very nature of backwardation in the oil strip curve (Chart 1). On the demand front, the International Energy Agency (IEA) has just upped its forecast for global crude demand this year by almost half a percentage point to 2.2%. This marks the third time the energy watchdog has changed its views of late. And last month’s revision is by far the single largest so far (Chart 2). Chances are that the IEA will once again have to ratchet up its estimate before the year is done, with global demand likely to grow by at least 2.5%. While demand forecasts are ratcheting up, those of supply growth are moving in the other direction. Among those are last year’s stunning reserve downgrades by a number of major oil firms, and cloudy prospects for the world’s top producers of crude. Saudi Arabia, traditionally the backstop of global supply, is already experiencing rising water rates in its mother lode Ghawar field, an early indicator of depletion that has already resulted in falling production levels in neighbouring Oman. And Russian production, which has accounted for three-quarters of non-OPEC oil growth in the past five years, seems to have recently peaked out. Faster Demand Growth Likely to Continue For 25 years global crude demand grew at a stable 1% average, in large measure because the bulk of that demand came from a handful of highly industrialized economies whose energy intensity had been falling since the OPEC shocks of the 1970s. Suddenly that all started to change about five years ago with the massive movement of industrial production from high wage countries to emerging industrial giants like China. Not only is China much less energy efficient than the economies most of that production was exiting from, but also the rapid rise in Chinese incomes has spearheaded a huge increase in their domestic energy consumption. As a result, world crude demand grew by 3.4% last year—the strongest pace in nearly 30 years and over three times the average pace of the past 25 years. China singlehandedly accounted for almost 40% of the global increase. Yet, per capita oil consumption in China, already the world’s second largest importer of crude these days, is still in its infancy, just an eighth of South Korea’s level (Chart 3). Even if China’s consumption grows at 15% a year for the next five years, fully matching 2004’s increase, it would still only be a quarter of Korea’s present energy consumption per capita. But China isn’t the sole reason oil demand is on the rise. Oil use is also rising explosively in other developing countries like India, which saw a 5% increase last year. Next to China, oil demand in the rest of developing Asia is growing at the fastest rate of any region in the world.
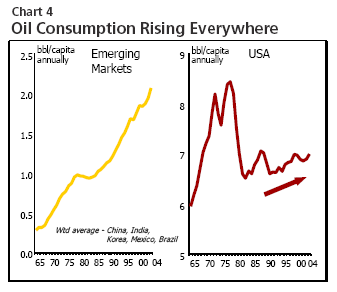 And demand may not even moderate in the world’s largest oil consuming economy, the US. American crude consumption per capita has been rising steadily since 1990 and shows no signs of abatement (see Chart 4 and Occasional Report #51: Is the US Economy Really Less Vulnerable to Energy Prices?). While that economy is certainly more energy efficient than it was thirty years ago, the increase in efficiency has been more than surpassed by the increase in energy usage. For example, the improvements in fuel economy for autos have been eclipsed by the increase in miles driven, while energy efficiency improvements in air conditioning and heating have been dwarfed by increases in home size. Exploding crude demand from rapidly industrializing Asian economies has permanently ratcheted up global crude demand growth. Even if energy demand growth slows in the US and Europe, and actually declines in Japan, world crude demand is unlikely to grow by less than 2.5% per year (Chart 5) without significant increases in crude prices.
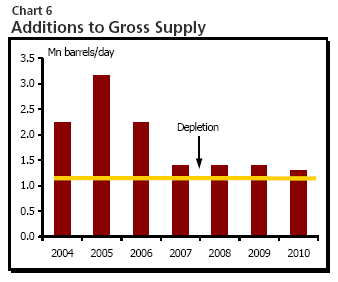
 The implications of current growth may soon become staggering relative to available supply growth. From a current base of just over 84 million barrels a day, global crude consumption would grow as briskly as it did before the OPEC shocks, with demand reaching almost 96 million barrels a day by 2010. Unfortunately, supply is unlikely to be able to keep pace. To the extent that it cannot, prices must ultimately ration demand. Limited Supply Growth to Lag Demand As noted in January Monthly Indicators, there is growing concern that future supply will not be able to respond to that pace of demand growth. The 5 to 6-year timeline for bringing a major new supply project on stream means that the trajectory for oil supplies through decade-end is largely defined by 50-60 major projects at various stages of the planning and development process. A survey of such projects suggests that beyond this year’s estimated 3 million barrels a day of production increase, the supply cushion is getting perilously small. As the oil market is finally beginning to recognize, OPEC spare capacity effectively sits at a record low of little more than one million barrels per day. The world is losing just over a million barrels a day of production from depletion every year. Net of depletion, global crude supply is unlikely to get above 85 million barrels a day this year, leaving a scant 1 million barrels a day of spare capacity in the system. And contrary to conventional wisdom, the oil market is poised to get much tighter, not slacker over the next four years. In fact, surveying the production schedules for new supply sources, 2005 is slated to be the biggest single year over the next four. Additions to gross supply fall off markedly in 2006, even more in subsequent years (Chart 6). Only about 300 thousand barrels of net new supply are likely to come on stream annually from 2006 through the end of the decade, as the new capacity added by major new projects does little more than offset declining production from mature fields. Global production is unlikely to get beyond 87 million barrels a day by the decade’s end.
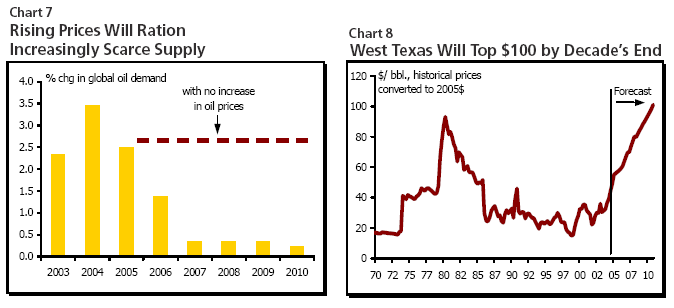
 Limited planned additions to new net supply suggest, moreover, that 2.5% trend demand growth in oil will run up against a supply barrier as early as 2007. Obviously, prices will have to rise to keep demand within the available supply constraint. Keeping a million barrels a day of reserve capacity in the system, demand must be constrained by the supply barrier. Next year, prices will have to take out over one million barrels of crude demand per day. But this figure rises rapidly in 2007 and 2008 as net supply growth tapers off (Table 1) due to the fall-off in mega-projects coming on stream. In 2007, demand must be cut by almost 3 million barrels a day, while in 2008 some 5 million barrels a day must be cut from trend demand. The demand cuts continue to rise, reaching 9 million bbl/ day from trend by 2010. Further Large Price Increases Needed to Balance Market How much prices have to rise to achieve those demand cuts depends on the price elasticity of demand for crude. Unfortunately, in the short-run there is very low price elasticity, meaning that it takes relatively large price increases to dampen demand. As a rough guide to estimating the price needed to confine demand to available supply, we have used an elasticity of 0.15 for global oil use. (That figure is derived by weighting US Department of Energy estimates of demand in major oil consuming regions by each region’s share of global oil demand.) A 0.15 elasticity means that a 10% rise in crude prices lowers crude demand by only 1.5% taking today’s roughly $55/bbl price as the benchmark, crude prices must rise to an average $61/bbl next year and to an average of $70/bbl by 2007 to achieve the needed demand cuts from trend (Chart 7). As those cuts begin to mushroom after 2007, so too must the price hikes required to bring them about. Crude prices need to rise to an average $80/bbl in 2008 and continue to rise to $101/bbl by 2010 (Chart 8).
 have used an elasticity of 0.15 for global oil use. (That figure is derived by weighting US Department of Energy estimates of demand in major oil consuming regions by each region’s share of global oil demand.) A 0.15 elasticity means that a 10% rise in crude prices lowers crude demand by only 1.5% taking today’s roughly $55/bbl price as the benchmark, crude prices must rise to an average $61/bbl next year and to an average of $70/bbl by 2007 to achieve the needed demand cuts from trend (Chart 7). As those cuts begin to mushroom after 2007, so too must the price hikes required to bring them about. Crude prices need to rise to an average $80/bbl in 2008 and continue to rise to $101/bbl by 2010 (Chart 8). In constant dollars, those prices would represent the highest the world has paid for oil since the second OPEC oil shock, some forty years ago. In today’s dollars, oil prices peaked at around $90/ bbl back in 1980. (It was actually about $40/bbl in the current dollars of the time). While prices are not expected to reach that level until 2010, the projected path of price increases nevertheless closely proxies the real cost of oil seen during the oil crises of the 1970s (Chart 8). Under our price targets demand tapers off markedly with global consumption growing at only an average 1% pace, roughly half of the trend growth we see now. Beyond 2010, the supply picture opens up again and no doubt $100/bbl oil will trigger accelerated development of tar sands and other non-conventional sources of crude supply. Since those are high cost supplies they may provide little moderating effect on price. Only the discovery and development of new conventional supply “elephants” would bring real price relief. Whether such discoveries will be made remains to be seen. But in the words of Matt Simmons, a noted oil commentator—”When it comes to oil exploration, you don’t leave the easiest for the last”. It should be noted that the projections do not take into account the possibility of a global recession and the subsequent feedback of recession to global crude demand. Past evidence shows that cyclical swings in demand can overwhelm any year-to-year change in supply growth. While a recession is certainly plausible over the next five years, particularly in light of how high crude prices will otherwise rise, it would serve as only a temporary diversion from rising energy prices. Throw in a year of flat global demand like we saw during the 2001 recession, and we would at most buy one to two years of price relief before global demand would quickly return to trend growth and an inevitable collision with supply constraints.
 by Jeff Rubin and Peter Buchanan from Occasional Report #53, CIBC World Markets
April 15th, 2005
Conflicts of Interest: CIBC World Markets’ analysts and economists are compensated from revenues generated by various CIBC World
Markets businesses, including CIBC World Markets’ Investment Banking Department. CIBC World Markets may have a long or short position
or deal as principal in the securities discussed herein, related securities or in options, futures or other derivative instruments based thereon.
The reader should not rely solely on this report in evaluating whether or not to buy or sell the securities of the subject company.
Legal Matters: This report is issued and approved for distribution by (i) in Canada by CIBC World Markets Inc., a member of the IDA and CIPF,
(ii) in the UK, CIBC World Markets plc, which is regulated by the FSA, and (iii) in Australia, CIBC World Markets Australia Limited, a member
of the Australian Stock Exchange and regulated by the ASIC (collectively, “CIBC World Markets”). This report has not been reviewed or
approved by CIBC World Markets Corp., a member of the NYSE and SIPC, and is intended for distribution in the United States only to Major
Institutional Investors (as such term is defined in SEC Rule 15a-6 and Section 15 of the Securities Act of 1934, as amended). This document
and any information contained herein are not intended for the use of private investors in the UK. The comments and views expressed in
this document are meant for the general interests of clients of CIBC World Markets Australia Limited. This report is provided for informational
purposes only. This report does not take into account the investment objectives, financial situation or specific needs of any particular client
of CIBC World Markets Inc. Before making an investment decision on the basis of any information contained in this report, the recipient should
consider whether such information is appropriate given the recipient’s particular investment needs, objectives and financial circumstances.
CIBC World Markets Inc. suggests that, prior to acting on any information contained herein, you contact one of our client advisers in your
jurisdiction to discuss your particular circumstances. Since the levels and bases of taxation can change, any reference in this report to the
impact of taxation should not be construed as offering tax advice; as with any transaction having potential tax implications, clients should
consult with their own tax advisors. Past performance is not a guarantee of future results. The information and any statistical data contained
herein were obtained from sources that we believe to be reliable, but we do not represent that they are accurate or complete, and they
should not be relied upon as such. All estimates and opinions expressed herein constitute judgements as of the date of this report and are
subject to change without notice. Although each company issuing this report is a wholly owned subsidiary of Canadian Imperial Bank of
Commerce (“CIBC”), each is solely responsible for its contractual obligations and commitments, and any securities products offered or
recommended to or purchased or sold in any client accounts (i) will not be insured by the Federal Deposit Insurance Corporation (“FDIC”),
the Canada Deposit Insurance Corporation or other similar deposit insurance, (ii) will not be deposits or other obligations of CIBC, (iii) will not
be endorsed or guaranteed by CIBC, and (iv) will be subject to investment risks, including possible loss of the principal invested. The CIBC
trademark is used under license.
© 2005 CIBC World Markets Inc. All rights reserved. Unauthorized use, distribution, duplication or disclosure without the prior written
permission of CIBC World Markets Inc. is prohibited by law and may result in prosecution.
|
| Home :: Archives :: Contact |
WEDNESDAY EDITION January 28th, 2026 © 2026 321energy.com |
|