|
THURSDAY EDITION May 22nd, 2025 |
|
Home :: Archives :: Contact |
 |
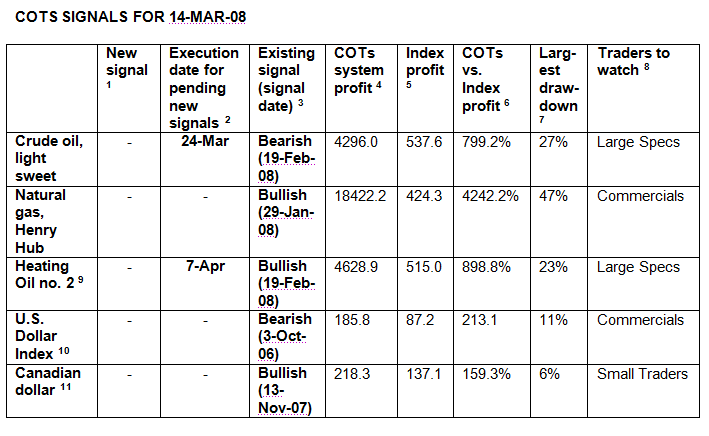
Traders Turn Bearish on CrudeBy Alex Roslin March 20, 2008 www.COTsTimer.Blogspot.com Crude prices flew decisively above $100 a barrel this month, but are now seesawing wildly, with a four-percent loss Monday followed by a similar-sized gain Tuesday. Do these ridiculous levels of volatility mean a top for crude or just a pause? An analyst at Goldman Sachs roiled markets last week with the suggestion that there could be lots more upside and forecast of $200 in the event of a supply disruption or political turmoil. Meanwhile, traders in crude futures and options are suggesting the opposite: it's time to take profits. Data from the Commitments of Traders reports shows the "dumb money" large speculators hitting a historic extreme of bullishness on crude in the Feb. 19 COTs report. My trading setup for crude oil works with a four-week trade delay, which means I'll go short for the open of next week's trading. This setup is based on studying the COTs data as reported weekly by the U.S. Commodity Futures Trading Commission. This free government data list trillions in futures and options holdings in 100 markets, including commodities, equities, currencies and Treasuries. My research has found that while the data doesn't have a strong correlation with week-to-week price fluctuations in those markets, it can be used to find reliable trading opportunities when traders hit extremes of bullishness and bearishness. Other highlights from the latest COTs report issued Friday, March 14: - My setup for natural gas has been on a tear since it flipped to bullish with the Jan. 29 COTs report. Natural gas shot up from $7.625 on the open of Monday, Feb. 4-the execution date for the trade-to an intraday high of $10.328 last Thursday, a 35-percent gain in under six weeks. Not bad! Of course, we all know natural gas corrected sharply this week. But my setup based on trading on the same side as the "smart money" commercial traders in is still on its bullish signal. Last Friday's COTs data shows the commercials significantly bumping up their net percentage-of-open-interest position, meaning they appear to believe still more gains are coming. Hard to believe, but that's what the data says, so I'm still long. - My setup for heating oil flipped to bullish with the Feb. 19 COTs report after the large speculators bumped up their net long position as a percentage of the total open interest. In this market, I've found it worked best to trade on the same side as the large specs. (Seems they're not always the dumb money.) This setup works with a six-week trade delay, meaning execution for the open of April 7. For more from the latest COTs report, check the table below. As well, visit my free blog at COTsTimer.Blogspot.com for important risk information, including my stop and risk-management provisions and how I trade my system. Also, see my signals for other commodities, equities Treasuries and currencies. Good luck this week! 
NOTES TO TABLES
March 20, 2008 www.COTsTimer.Blogspot.com Disclaimer This report isn't meant as financial advice or a recommendation to buy or sell any security. Please do your own homework before trading. My system isn't for everyone, involves substantial risk and has experienced large drawdowns in some past trades. Past results are no guarantee of future profits. I'm not a certified financial advisor. While I consider my information to be reliable and accurate, I make no guarantees. Please see COTsTimer.Blogspot.com for other disclaimer information. |
| Home :: Archives :: Contact |
THURSDAY EDITION May 22nd, 2025 © 2025 321energy.com |
|