|
WEDNESDAY EDITION June 24th, 2026 |
|
Home :: Archives :: Contact |
|
|
Oil Market Update...Clive Maund support@clivemaund.com December 12th, 2019 We haven't paid oil much attention this year, which is reasonable because it has for the most part been a dull and boring market. There was a flurry of excitement in September on facilities in Saudi Arabia being bombed, but when things quietened down again afterwards, the oil market went back to sleep. We can see the largely rangebound market of the recent past on the latest 6-month chart for Light Crude. Although this chart might well incline one to yawn, there are several subtle signs of technical improvement on it worth noting, especially when we later put them into the context of longer-term charts. The first is that, after being unfavorably aligned during the first half of the year, the main moving averages have now swung into an alignment that is much more conducive to a new bullmarket phase beginning. The second related improvement is that the trend of momentum (MACD) has steadily improved after being somewhat negative early in the year, so that it is now modestly positive. The third improvement is that the Accumulation line has advanced significantly since the early October low. While none of these factors individually or even taken together guarantee that oil will go on to soon break above the nearby resistance shown, they do increase the chances of this happening, and the fact that other commodities like gold and silver (when they get moving again) and copper are now advancing is also a help. 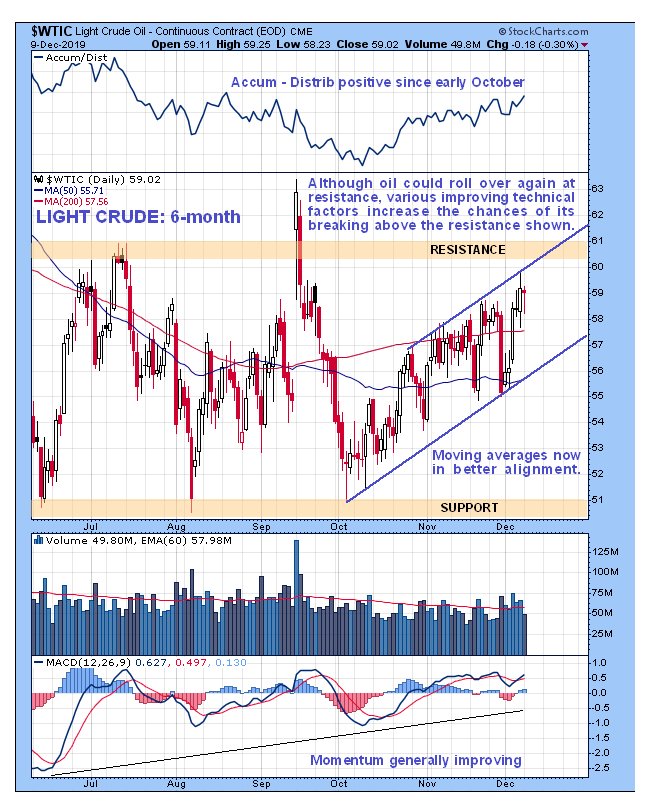 Now we'll put these subtle developments into the context of the bigger picture by zooming out to look at the longer-term 2-year chart. Again this picture is not very inspiring at first sight for we see that oil has been fluctuating in an increasingly narrow range since it plummeted late in 2018, roughly bounded by the large Triangular pattern shown whose boundaries are provisional, but with respect to its current status there are several key points to note. The first and most important is that with the Triangle now closing up, a larger move than we have seen for a long time looks likely soon. The second point is that both the volume indicators shown have been trending higher relative to price overall and showing quite a marked positive divergence, which makes a breakout to the upside more likely. The third key point is a fundamental one, which is that with the Fed on board printing money like crazy to keep the party going, the stockmarket looks like it is going into a parabolic blowoff, and a concomitant development is that this will fuel a ramp in inflation that will drive up commodity prices, especially copper, as we have already noted, which is headed for a supply crunch. So the chances of oil advancing from here look good. 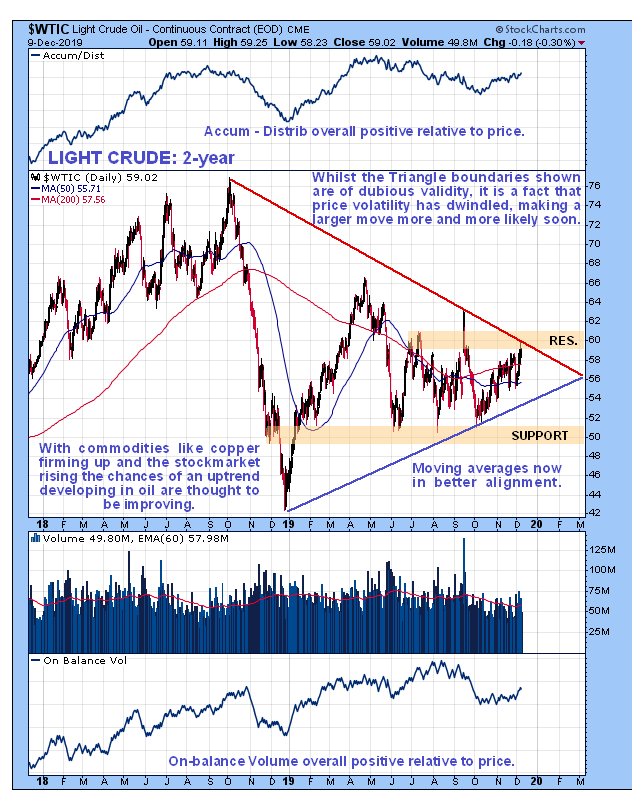 Moving on, although the 10-year chart shows a rather messy technical picture, it does show more dramatically the overall strength of the volume indicators relative to price and also makes clear that if oil does break out to the upside from the Triagle, it will not have to contend with any serious resistance until it gets to the $75 area, which will arise from the underside of the topping pattern that formed from 2011 through 2014. 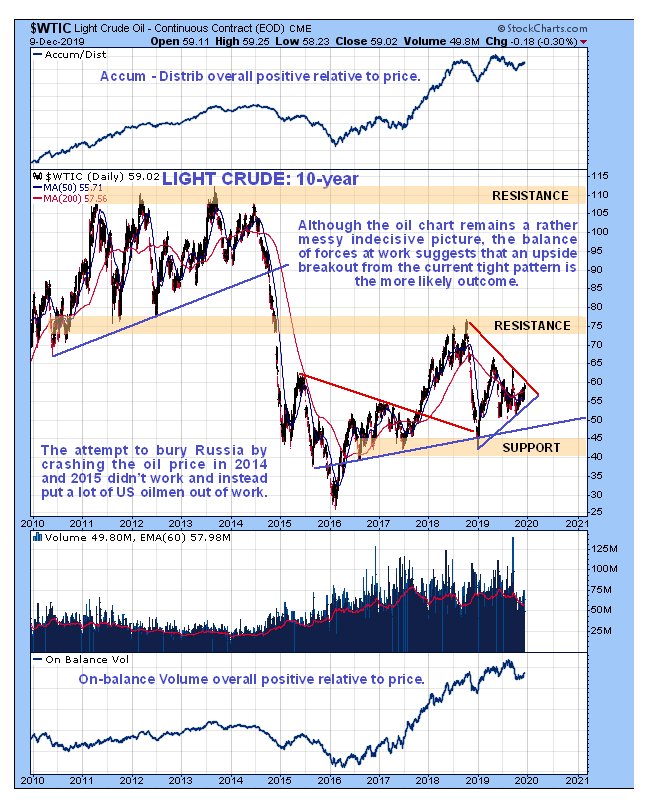 Alright, so what about oil stocks?. Given what we are seeing on the oil charts, how are they looking. To find out we will look at the chart for the XOI oil index. Starting with the 6-month chart we see that oil stocks look like they are at a fairly good entry point here after their November and early December reaction back to the supporting trendline shown. To build on this modestly positive picture the index will have to stay above this trendline and then advance off it - if it fails then the index is likely to drop back to the support in the vicinity of its October lows where we would look for a Double Bottom to form. 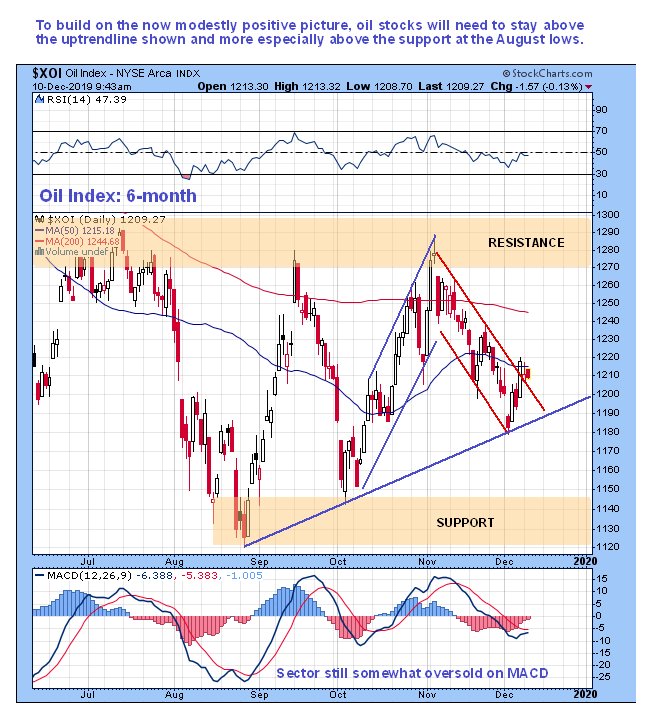 On the 2-year chart for the XOI index, which has the S&P500 index appended at the top, we see that the sector has not joined in the broad market rally of recent weeks, which is unusual, and might have something to do with the increasing perception of the oil industry as a "smokestack" industry eventually doomed to go the way of the dinosaurs, like coal, a perception that is being worked on by young Greta and her friends in the environmental movement. Nevertheless, the oil industry is not going to roll over and die anytime soon - the world is too dependent on it, so there is certainly considerable scope now for a significant snapback rally, and the chances of such a rally getting going are improved by the current close bunching of the index and its moving averages and by the improving trend of momentum (MACD) shown on this chart and of course they will be increased further if the broad market continues to advance, and especially if it accelerates to the upside, which, as it is approaching the parabolic blowoff phase, is increasingly likely. 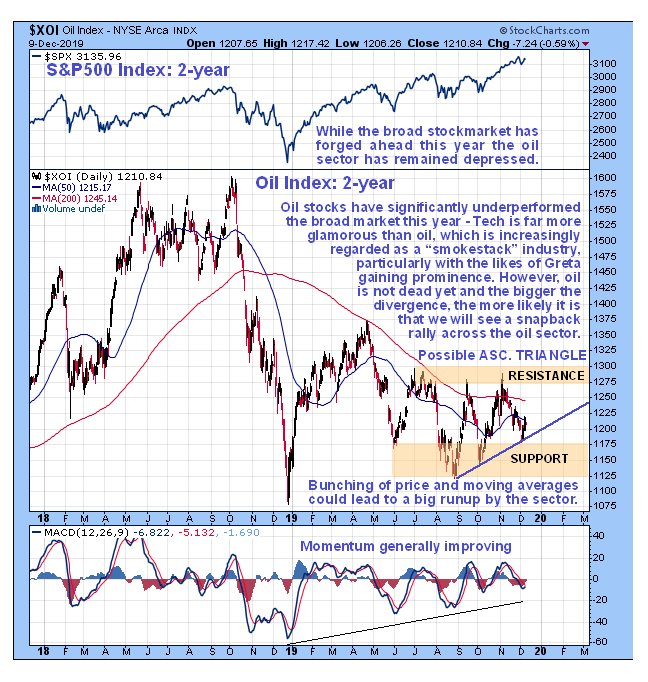 So the 1st positive development for oil sector bulls to look out for is the XOI index breaking out of its current short-term downtrend in force from early November and advancing to the resistance in the 1270 - 1300 zone (the pattern that has formed from the late August low may be a bullish Ascending Triangle). If it should succeed in breaking above this, then much more substantial gains will be in prospect. End of update. Clive Maund December 12th, 2019 support@clivemaund.com Clive Maund is an English technical analyst, holding a diploma from the Society of Technical Analysts, Cambridge and lives in The Lake District, Chile. Visit his subscription website at clivemaund.com .[You can subscribe here]. Clivemaund.com is dedicated to serious investors and traders in the precious metals and energy sectors. I offer my no nonsense, premium analysis to subscribers. Our project is 100% subscriber supported. We take no advertising or incentives from the companies we cover. If you are serious about making some real profits, this site is for you! Happy trading. No responsibility can be accepted for losses that may result as a consequence of trading on the basis of this analysis. Copyright © 2003-2017 CliveMaund. All Rights Reserved. |
| Home :: Archives :: Contact |
WEDNESDAY EDITION June 24th, 2026 © 2026 321energy.com |
|