|
WEDNESDAY EDITION June 24th, 2026 |
|
Home :: Archives :: Contact |
|
|
Oil Market UpdateClive Maund support@clivemaund.com July 30th, 2019 A commodity that will certainly not do well in a recession / depression is oil. So much capacity has been brought onstream in recent years, particularly in the US, that in any economic contraction, supply will quickly turn into oversupply. As we know, a cyclical recession / depression is already well overdue and it has only been staved off so far by rate slashing and reckless money printing which will eventually have catastrophic consequences. We have now arrived at the stage where desperate rate reductions and bouts of QE are having little to no effect - they are pushing on a piece of string as we transition from the stage where we have zombie banks and companies to a global zombie economy. About the only hope for the oil producers is if they can somehow engineer a crisis by, for example, goading Iran into blocking the Straits of Hormuz, and, as it happens, that appears to be what is in train, and they have much more chance of achieving this because they have Israel on side, which is looking for any opportunity to inflict damage on Iran and has the US military at its disposal to this end. While the blocking of the Straits of Hormuz and the ensuing crisis in the oil markets would certainly generate massive windfall profits for oil producers and oil companies over a medium-term timeframe, this tactic will not be good for anyone long-term because it will implode the global economy which is already in a very fragile state due to widespread extreme debt. So we have to ask whose priorities will prevail? - that of the international community of nations, or that of Israel and the oil producing countries and companies, who, to put it mildly, are an extremely powerful lobby, and from what we are seeing on the ground so far with various orchestrated incidents near to and in the Persian Gulf, the will of the latter may be about to prevail and if it does, we are looking at an imminent extreme economic crisis. The one hope is that common sense will prevail and that Israel and the oil producers and companies grasp that it is ultimately not in their interest either to implode the world economy. However, as we recall, common sense did not prevail before either the 1st World War or the 2nd, or for that matter Vietnam. The average citizen has no more understanding of what is really going on in the world of geopolitics than a Labrador. Consider the typical British "Tommy" going off to fight in the 1st World War. These men were mostly young and while not necessarily stupid, they were woefully ignorant and naive and many of them paid for it with their lives or their health - who but an idiot would go and stand in a mud-filled trench for up to 4 years for a politician? - and that's if they survived that long. They succumbed to the lie - perpetuated to this day more than a hundred years later - that the Germans were predatory aggressors who had to be confronted to "defend the Empire" when the truth was the polar opposite. The British Empire felt threatened by the rise of Germany and tricked it into a war so that it could destroy it. This is why, after the war, Germany was subject to onerous reparations that resulted in hyperinflation and the death of millions. When you grasp this you understand precisely why these injustices and the extreme conditions they gave rise to created the conditions for Hitler to come to power. This is pointed out to illustrate that you should never believe the official tabloid line on anything, and right now that includes the story being spun with respect to Iran. Having glanced at the fundamentals we will now proceed to look at the oil charts, specifically those for Light Crude. We will "drill down", starting with a very long-term chart and working our way through a range of charts and then more horizontally by ending with a look at a couple of shorter-term charts. The very long-term chart going way back to 1982 is most interesting and gives us a "big picture" perspective on what is going on. On this illuminating chart we see that oil has essentially been in a major bearmarket since its massive 2008 parabolic blowoff top. The pattern is a classic 3-wave A-B-C bearmarket starting with an A-wave slam in 2008 that was of course made much worse because it synchronized with the general market crash at that time. This was followed by a big B-wave countertrend bearmarket rally that got as high as about $113 in 2011, whereupon, after a topping out process, it went into the destructive C-wave decline that took it even lower than the 2008 crash low by the time it hit bottom early in 2016 and led to the laying off of many US oil workers. A driving force behind this decline was the attempt to crush Russia, which is highly dependent on oil revenue, but the attempt failed because Russia can cope with lower oil prices. Even though the C-wave low normally marks the end of the bearmarket, we would still need to see a bottoming process, which means that oil could easily return to its lows again, and if a recession / depression hits it is likely to drop well below them, especially given all the new capacity brought online in recent years, as mentioned above. So, barring a blocking of the Straits of Hormuz, the outlook is grim. 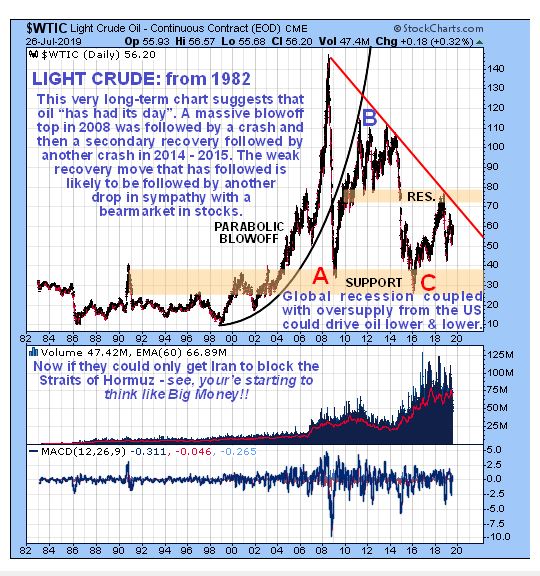 The 14-year chart allows us to see in more detail the bearmarket from the 2008 parabolic blowoff top to the present. The 2008 - 2009 crash plunge was followed by a big B-wave countertrend rally that peaked at about $113 and after the development of a topping Triangle was followed by another severe decline that was triggered by failure of the lower boundary of the Triangle. While this decline was not as extreme as the one in 2008 it caused mayhem in the US oil industry. Since the early 2016 low we have seen a lesser recovery which petered out late last year leading to renewed decline. While the bearmarket could have ended with the C-wave low early in 2016, that depends on whether or not the economy holds up, which at this point doesn't look likely, but even if it does the oil market will probably need to build out a base that will probably involve a test of those lows. 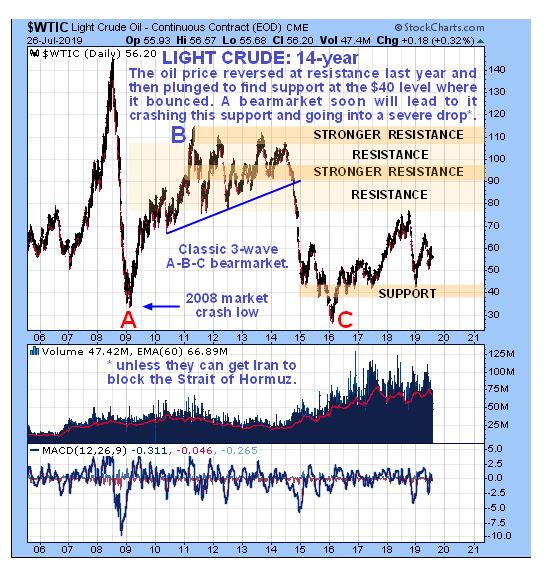 Zooming in further via the 6-year chart we see that, while the price recovery from the early 2016 lows has certainly been significant in percentage terms, the uptrend was rather insipid and led to it reversing into another decline late last year. Right now it is looking weak and prone to further decline, which will be exacerbated if stocks enter a bearmarket soon, as looks likely. 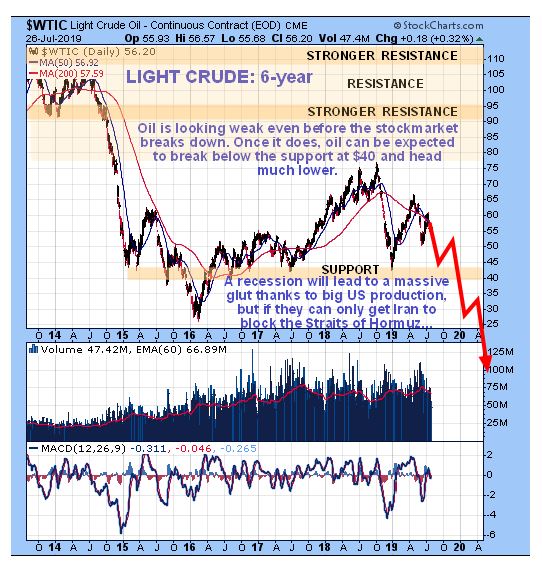 On the latest 8-month chart we see recent action in much more detail, and on this chart we have appended the Accumulation line at the bottom and the S&P500 index at the top. The Accumulation line is weak - it is well below where it was at the June price trough - which is bearish and calls for lower prices down the road. The oil price may also be a "canary in the coal mine" for the stockmarket, since sagging demand for oil is not a sign of a strong economy, and you will recall from the recent update on the US stockmarket that we are not taken in by the performance of the "shop window" Dow Industrials and S&P500 indices which are skewed due to data manipulation. 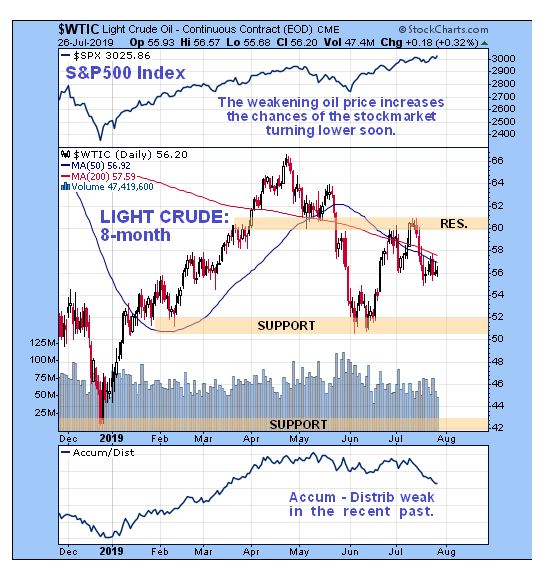 Finally, we look at the 4-month chart which allows us to see recent action in even more detail. On this chart we can see that an ugly little pattern has formed over the past month which is suspected to be a small downsloping Head-and-Shoulders top that projects the price down at least to the support in the $50 area and possibly lower with the chances of this scenario eventuating greatly increased by the weak accumulation line shown at the top of the chart. 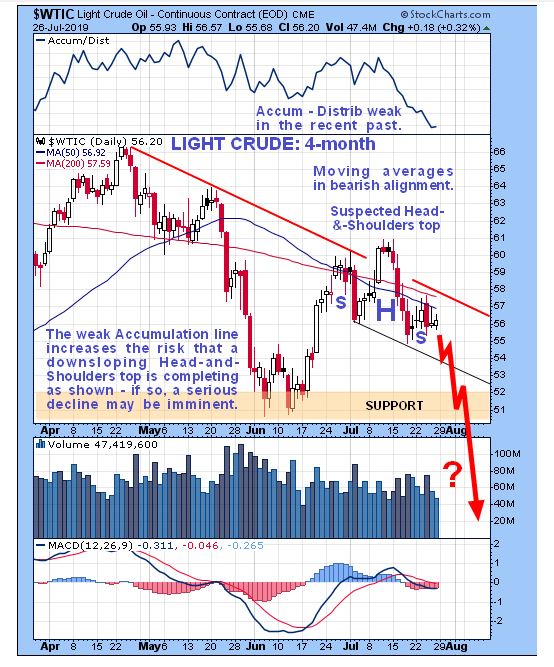 As for oil stocks, recently they have been moving largely in tandem with oil itself, as we can see on the latest 6-month chart for the XOI oil index, which has the Light Crude chart added at the top. This chart looks weak with momentum rolling over and moving averages in bearish alignment, suggesting that this index will break below the nearby support it is perched just above and drop. So, in general, oil stocks look like a good short here. 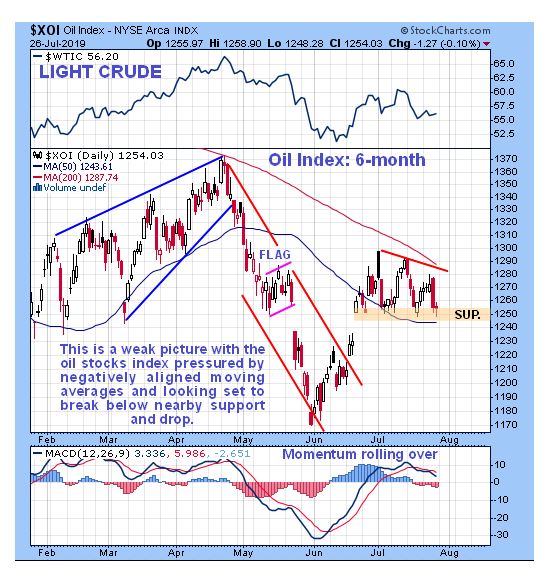 So, to sum up, barring an extreme development like Iran blocking the Strait of Hormuz, the outlook for oil is bearish and bleak, with lower prices in prospect and possibly much lower prices. End of update. Clive Maund July 30th, 2019 support@clivemaund.com Clive Maund is an English technical analyst, holding a diploma from the Society of Technical Analysts, Cambridge and lives in The Lake District, Chile. Visit his subscription website at clivemaund.com .[You can subscribe here]. Clivemaund.com is dedicated to serious investors and traders in the precious metals and energy sectors. I offer my no nonsense, premium analysis to subscribers. Our project is 100% subscriber supported. We take no advertising or incentives from the companies we cover. If you are serious about making some real profits, this site is for you! Happy trading. No responsibility can be accepted for losses that may result as a consequence of trading on the basis of this analysis. Copyright © 2003-2017 CliveMaund. All Rights Reserved. |
| Home :: Archives :: Contact |
WEDNESDAY EDITION June 24th, 2026 © 2026 321energy.com |
|