|
WEDNESDAY EDITION June 24th, 2026 |
|
Home :: Archives :: Contact |
|
|
Oil Market Update - GIANT TOP APPROACHING COMPLETION...Clive Maund May 5th, 2023 Oil has been largely rangebound since the last update posted early in November with the trend being neutral / down. On the 18-month chart for Light Crude we can see that technically it remains in the bearmarket that began following the twin peaks (Double Tops) that occurred last year with the price being constrained by the falling 200-day moving average that reversed the late March – early April rally. Whilst downside momentum has slowed somewhat there are reasons for that, one of which is the feeble rally by the stockmarket since its low of last October, but this doesn’t mean that we won’t see a more serious decline later. 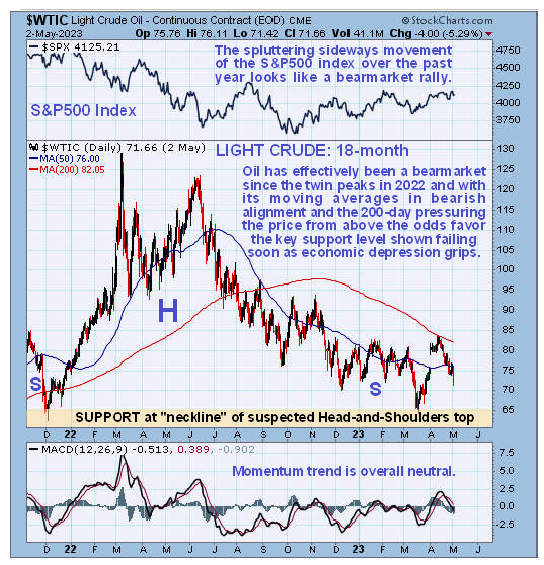 Fundamentally, oil faces serious headwinds going forward with an impending economic depression that can be expected to slash global demand significantly, made worse by the rogue and woke political establishment who are very anti-oil. Whilst oil has been in a decelerating downtrend for the past 10 to 11 months, it is not clear on the 18-month chart just what is going on, so to gain more perspective we will now move on to consideration of the longer-term 5-year chart. On the 5-year chart it is becoming increasingly obvious that a large Head-and-Shoulders top is forming above a band of quite strong support down to and at the $60 level, and even if the pattern doesn’t technically qualify as an H&S top, it is clear that failure of the support at $60 will open the door to a much more serious decline. The S&P500 index is shown at the top of this chart and we can see that, broadly speaking, oil and the stockmarket have been moving in tandem at least as far as their major trends go. This being so, if the stockmarket turns sharply lower, viewed as increasingly likely given the massive line out of Banks waiting to declare bankruptcy, then oil could soon crash this support and drop away steeply. 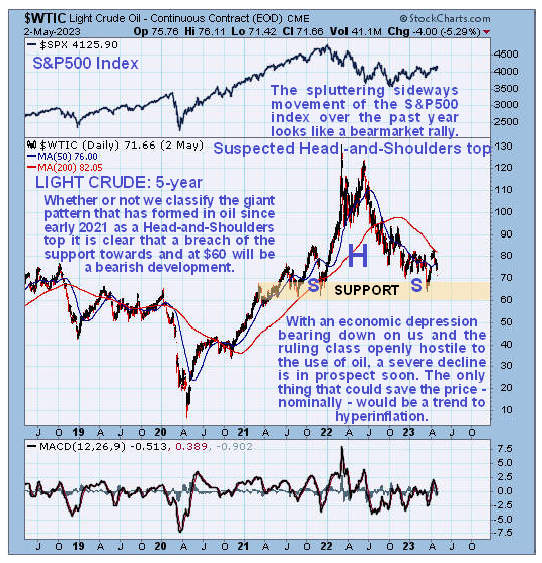 So what about oil stocks? On the 18-month chart for the XOI oil stocks index we can see that, after outperforming the broad stockmarket for most of last year, oil stocks have underperformed from last November with momentum gradually turning negative. This index has dropped steeply in recent days and without a significant reversal to the upside very soon we will see a bearish cross of its main moving averages, the first time this has happened since late 2018! On this chart it looks like a large top has been forming for nearly a year now. 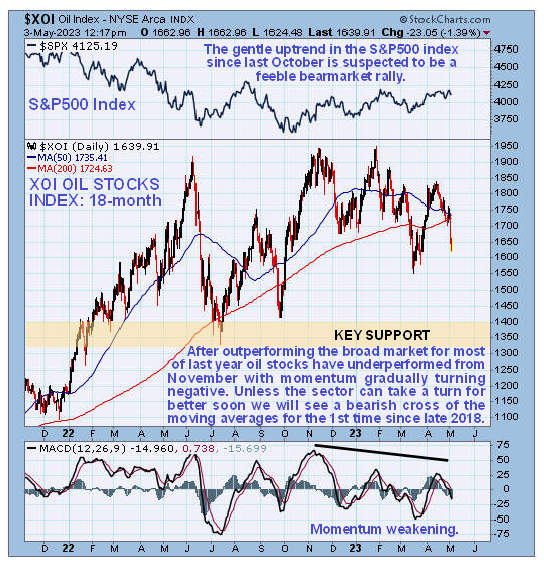 On the 5-year chart for the XOI oil index we see that the sector has been in a powerful uptrend since the 2020 Double Bottom that has resulted in it more than tripling in value from its lows. This is a very big gain for a sector in less than three years and of course a big reason for it is the extreme low oil prices that prevailed for a while in the Spring of 2020 during the Covid panic when it briefly became worthless. However we can now see that, following the buildout of what looks like a top pattern for almost a year, the oil index is on the point of breaking down from this major uptrend and it might have done so today after the Fed statement that caused markets to drop. Over the near-term the index looks set to continue to drop, perhaps after a minor relief rally, initially to the support level shown, but failure of this support would open up the prospect of a much more severe decline due to a collapse in demand resulting from reduced economic activity. 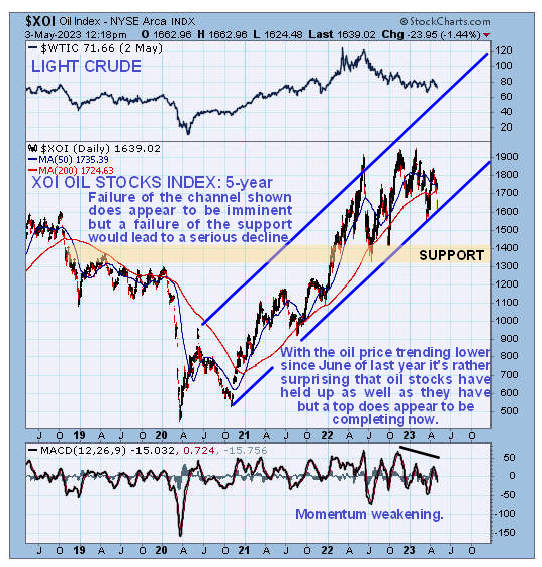 End of update. Clive Maund May 5th, 2023 support@clivemaund.com Clive Maund is an English technical analyst, holding a diploma from the Society of Technical Analysts, Cambridge and lives in The Lake District, Chile. Visit his subscription website at clivemaund.com .[You can subscribe here]. Clivemaund.com is dedicated to serious investors and traders in the precious metals and energy sectors. I offer my no nonsense, premium analysis to subscribers. Our project is 100% subscriber supported. We take no advertising or incentives from the companies we cover. If you are serious about making some real profits, this site is for you! Happy trading. No responsibility can be accepted for losses that may result as a consequence of trading on the basis of this analysis. Copyright © 2003-2026 CliveMaund. All Rights Reserved. |
| Home :: Archives :: Contact |
WEDNESDAY EDITION June 24th, 2026 © 2026 321energy.com |
|