Oil Market Update
Clive Maund
support@clivemaund.com
March 29th, 2015
In the last update over a month ago it was stated that it was too early for oil to stage a sustainable rally, and that it would retreat, either to continue marking out a base pattern or drop to new lows. In the event it did both - it dropped to marginal new lows before recovering and rallying, so that we now have a potential W pattern base on the chart. This new update has been prompted for a different reason, however, because there has been a sudden quite dramatic improvement in oil's COT structure over the past week or two.
On the 10-year chart for Light Crude we can see that following oil's plunge during the 2nd half of last year, it has been struggling to stabilize and may be forming a base pattern around current levels, although there remains the risk of further losses towards the support near to the 2008 lows in the low $30's. However latest COTs suggest that this risk is decreasing, which fundamentally may be related to what is going on the Mid-East, especially Yemen.

On the 1-year chart for Light Crude we can see how a W pattern has formed in oil over the past several months, involving a potential Double Bottom at the late January and mid-March lows. The big question of course is whether this pattern is a continuation pattern that will lead to a breakdown and another serious downleg, or whether it is a base pattern that will lead to an upside breakout and a recovery. The main forces operating on the oil market at this time are weak demand, presented by spin doctors as oversupply in the same way that the collapse in the Baltic Dry Index is presented as being due to a surplus of ships, and on the bullish side of the occasion, the risk of eventual supply disruption from the Mid-East, especially Saudi Arabia. These are the chief forces that are battling for supremacy and that will determine the direction of the next big move. Action on Friday in oil suggests that it is failing again at the resistance shown and likely to drop back short-term. However, the latest COTs suggest that the overall outlook for oil is improving, and that any short-term dip is likely to be modest and followed by a reversal to the upside leading to a possible upside breakout from the W trading range.

The latest COT chart shows that although oil fell heavily late last year, the COT structure only improved at a very modest rate, with Commercial short and Large Spec long positions only moderating gradually. However, this has started to change over the past two weeks, and especially last week, when there was a quite dramatic reduction in positions that is interpreted as bullish. This change increases the chances that the oil price will break out upside from the recent trading range.

Click on chart to popup a larger clearer version.
We can see the quite dramatic improvement in the COT structure otherwise expressed on the Hedgers chart shown below. This chart suggest that "something is cooking up" in the oil market, and while we can speculate about what the cause might be, such as mayhem in Yemen leading to an existential threat to Saudi Arabia, the reasons are not really important to us as long as we are on the right side of the trade. When the indicator is way below the red dotted line it is bearish, and it certainly was last Summer, and when it is way above it, it is bullish.

Click on chart to popup a larger clearer version.
Chart courtesy of www.sentimentrader.com
It is also interesting to look at the Hedgers chart over a much longer timeframe, and compare the readings to the peaks and troughs in oil. On the chart below, which goes back to the start of 2007, we can see that when the indicator gets over halfway towards the top of the corridor between the dotted lines, a rally in the oil price usually ensues (the green dotted line on this chart looks like it should be calibrated more tightly).

Click on chart to popup a larger clearer version.
Chart courtesy of www.sentimentrader.com
The Crude Oil Optix, or optimism chart shown below indicates an extreme level of pessimism that in the past has lead to a substantial rally, and also suggests a high probability that oil is basing here.

Click on chart to popup a larger clearer version.
Chart courtesy of www.sentimentrader.com
Finally, while seasonal factors are of course only a background influence, the chart shown below reveals that seasonals are positive through September and especially positive over the next month or so.
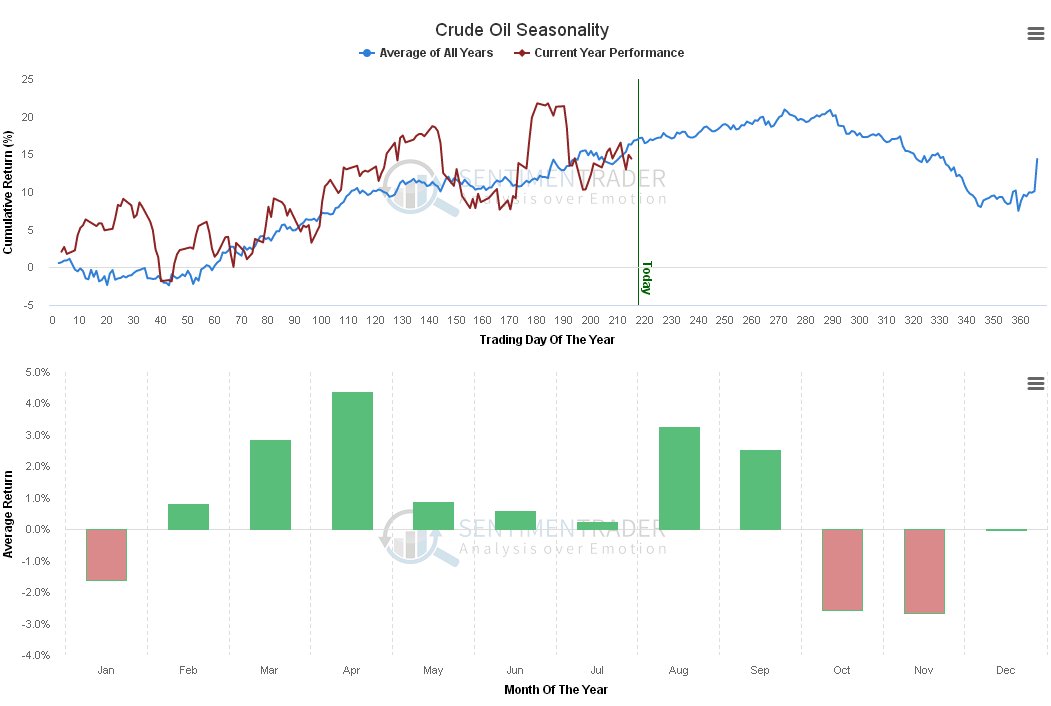
Click on chart to popup a larger clearer version.
Chart courtesy of www.sentimentrader.com
Turning to oil stocks we see on the 10-year chart for the XOI oil index that they have held up remarkably well given what happened to the oil price during the 2nd half of last year. We can also see on this chart that this index has reacted back close to a line of strong support, which is the lower boundary of the giant uptrend shown. If oil does break out upside from its potential base pattern, this is a good point for oil stocks to turn up. A complicating factor is considering what will happen to this index if the broad market breaks down from its bearish Rising Wedge pattern and tanks, as expected. However, if this were to happen as a result of a major crisis in the Mid-East, we could see a situation where the broad market plummets partly as a result of a Mid-East crisis that triggers a sharp rise in the price of oil.

On the 1-year chart for the XOI oil index we can see that it performed rather poorly on oil's latest rally from its mid-March lows, only managing a feeble rally in sympathy, so it looks set to drop back short-term in tune with oil. However, it is thought likely that it will find support again at its long-term uptrend support line shown on the 10-year chart, and if oil holds up it should then advance.

Conclusion: COTs and Optix indicate that the chances are improving that oil is basing here and set to break out upside. Latest price action suggests a brief dip is probable before an attempt to break out upside occurs.
End of update.
Clive Maund
March 29th, 2015
support@clivemaund.com
Clive
Maund is an English technical analyst, holding a diploma from
the Society of Technical Analysts, Cambridge and lives in The Lake District, Chile.
Visit his subscription website at
clivemaund.com .[You can subscribe
here].
Clivemaund.com is dedicated to serious investors and traders in the precious metals and energy sectors. I offer my no nonsense, premium analysis to subscribers. Our project is 100% subscriber supported. We take no advertising or incentives from the companies we cover. If you are serious about making some real profits, this site is for you! Happy trading.
No responsibility can be accepted for losses that may result
as a consequence of trading on the basis of this analysis.
Copyright
© 2003-2012 CliveMaund. All Rights Reserved.