|
MONDAY EDITION June 15th, 2026 |
|
Home :: Archives :: Contact |
|
|
Oil Market Update...Clive Maund March 14th, 2020 Oil is done, finished - its glory days are over. Notwithstanding any technical rally from may result from its current deeply oversold condition, it is expected to remain depressed over the longer-term, due to the impending global depression caused by the implosion of the "everything bubble", and oversupply in part generated by the fracking and shale boom in the US. The Saudi decision last weekend to both slash prices and boost output in the face of collapsing world demand was classic "cut off your nose to spite your face" "shoot yourself in the foot" stupidity. If the intention was to force Russia back to the negotiating table, it will fail, because Russia has much more ability to live with low prices than Saudi Arabia has - what will happen is that Saudi Arabia will suffer severe budgetary shortfalls which will lead to cuts in employment and social programs etc. that can be expected to result in serious civil unrest. This is doubtless why Mohammad Bin Salman preemptively arrested several Saudi Princes and army officers who might be contenders for power in the looming crisis. He might have more success wrecking the US oil sector, but even here, because of the dependence of the credit markets on US oil investments, they might weather the storm by means of further support from banks and buyers of junk bonds and if that happens MBS may well be forced to eat humble pie and backpedal, and oil could be so cheap by then that a major opportunity will present itself across the sector, so we'll be on the lookout for that, although such a development is probably still a long way off. Now let's review the oil charts which present a picture of unmitigated disaster after absolute carnage across the sector. You may recall that we actually used the falling oil price - and Baltic Dry index and copper price - in January to predict the imminent onset of the market crash, which also emboldened us to go for Puts in Tech stocks like Apple before it cratered. You can see this January divergence between the oil price and the stockmarket on the 6-month Light Crude chart below, with the S&P500 index chart at the top of it. Observe how oil's technicals started to deteriorate early in January with a nasty reversal candle followed by an ominous break below both moving averages. The classic bearish action continued into February with a countertrend rally in the middle of the month giving oil sector investors a last chance to get out before the bearish "death cross" of the moving averages later in the month sparked a waterfall decline culminating in the catastrophic massive gap down last Monday that triggered a crisis in the credit markets and this week's stockmarket rout. 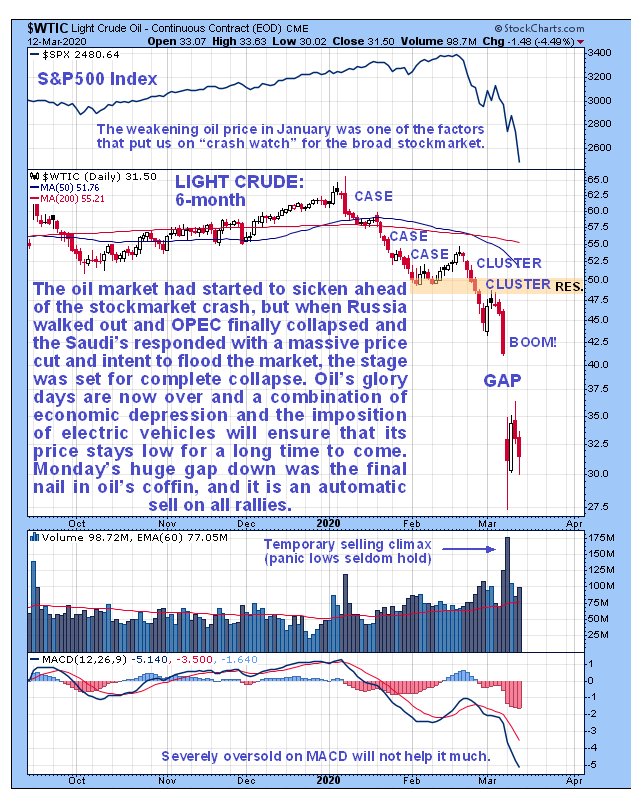 Is that it? - was that the final selling climax for oil? - unlikely, unless you think that MBS will soon become repentant and reappear before what's left of OPEC cap in hand and declare "I goofed up - I am going to reverse the price cuts and production increases" Given the nature of the man this is highly unlikely - instead he will probably have to have his "nose firmly pushed in it" by first the markets and then his own feisty and by that time rebellious subjects before that happens. What therefore seems more likely is that a bear Flag forms here before oil breaks lower again and heads into the low $20's. Someone wrote recently that the cost of producing oil is on average somewhere in the low $30's. That may be true but before this can have a positive impact on the price, the glut will have to be absorbed and a lot of production idled to bring supply and demand back into balance, a process that will be retarded by the expected global depression. Oil's plunge this week not only broke it below the nearby support shown on the 6-month chart, it also broke it below an important support level in the $42.50 area shown on the 3-year chart for Light Crude below. Although heavily oversold here, this may only lead to the formation of a bear Flag to ease the oversold condition before it drops hard again. 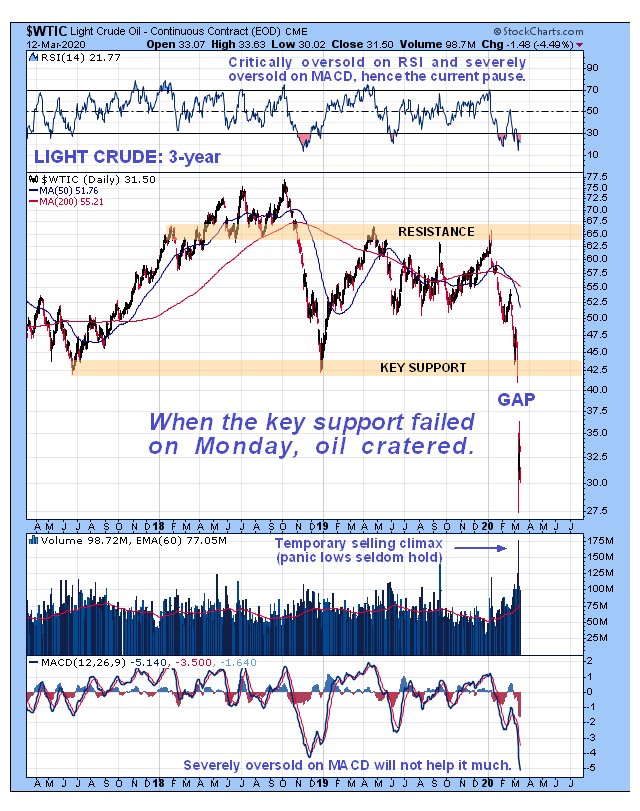 The 15-year chart gives us Big Picture perspective, this timeframe being selected to enable us to see the all-time highs in the high $140's in 2008 that were followed by an astonishingly severe decline all the way back to the mid-$30's during the 2008 market crash. On this chart we can also see the brutal decline into the mid-$20's that occurred from 2014 through early 2016 when the Saudi's first tried to destroy US shale producers, which failed because they were propped up by big-hearted banks and junk bond buyers. Last week's plunge has brought us back very close to those lows, which for the reasons given above are expected to be breached. Before leaving this chart it is worth noting that Light Crude got considerably more oversold on its MACD back in 2008 than it is now. 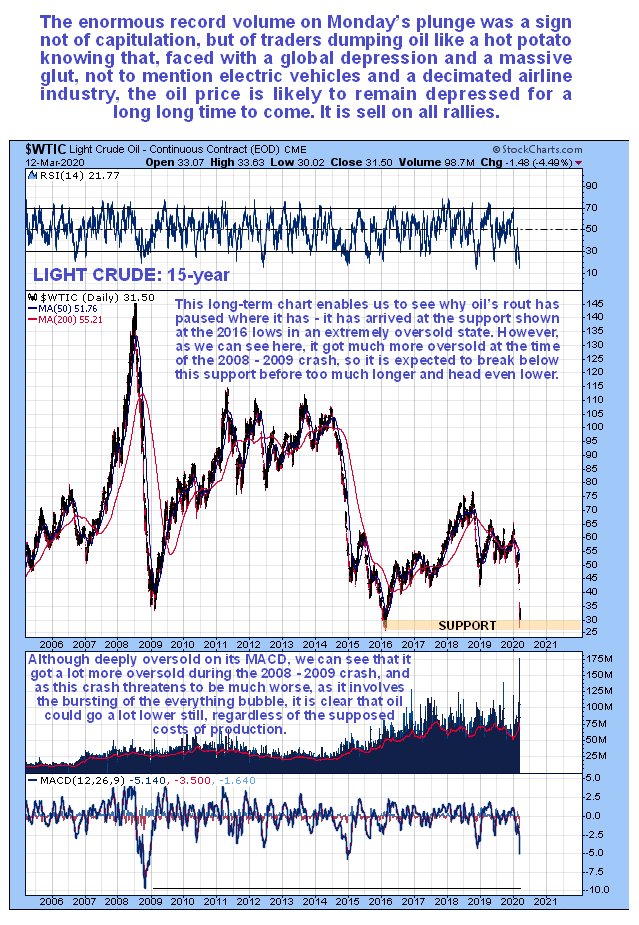 Now we will look at what has happened to oil stocks during the period of this severe decline in the oil price, using the XOI oil stocks index. Starting with the 6-month chart we see that the drop over the past several weeks has been brutal, with oil stocks going into virtual freefall and losing almost half of their value. Unlike oil itself, which sat within its suspected Flag pattern yesterday, oil stocks plunged again yesterday to new lows, becoming even more severely oversold in the process and thus making a snapback rally more likely soon. 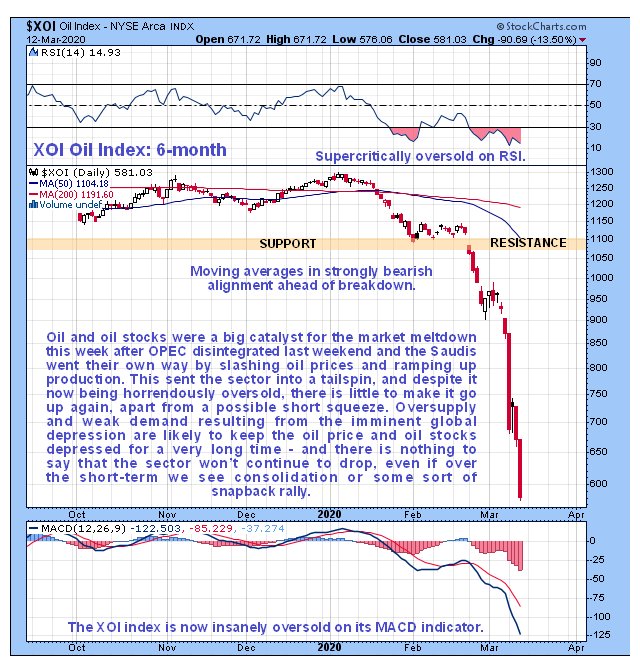 The 3-year chart shows that upon crashing an important support level last week that dates back to lows in 2016 and 2017, the index cratered in sympathy with the broad stockmarket to become insanely record oversold - much more oversold than oil itself. 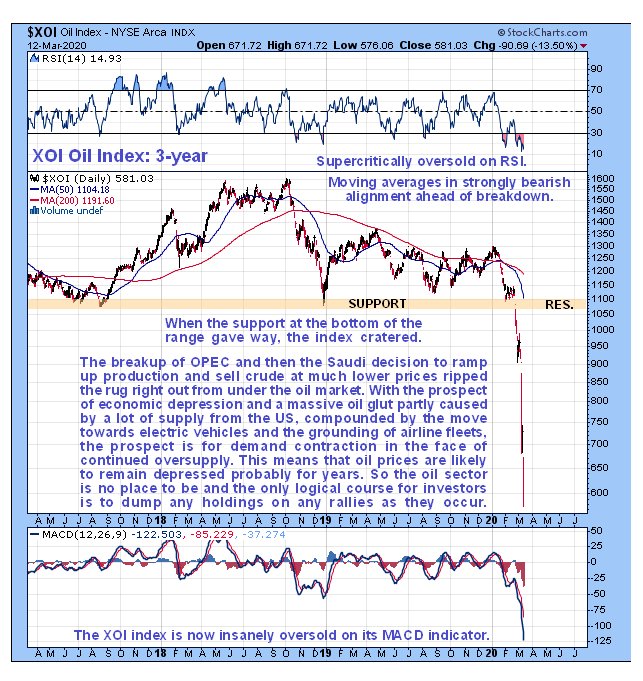 Just how oversold it has become can be seen on the long-term 15-year chart on which we see that it is considerably more oversold on its MACD indicator than it was even during the worst of the 2008 market crash. On this chart we also see that it has crashed the support at the 2008 - 2009 bearmarket lows, dropping well below them, and even though its unprecedented oversold state could lead to a snapback rally, the grim outlook for oil (and the economy) suggests that it will eventually head to still lower levels. 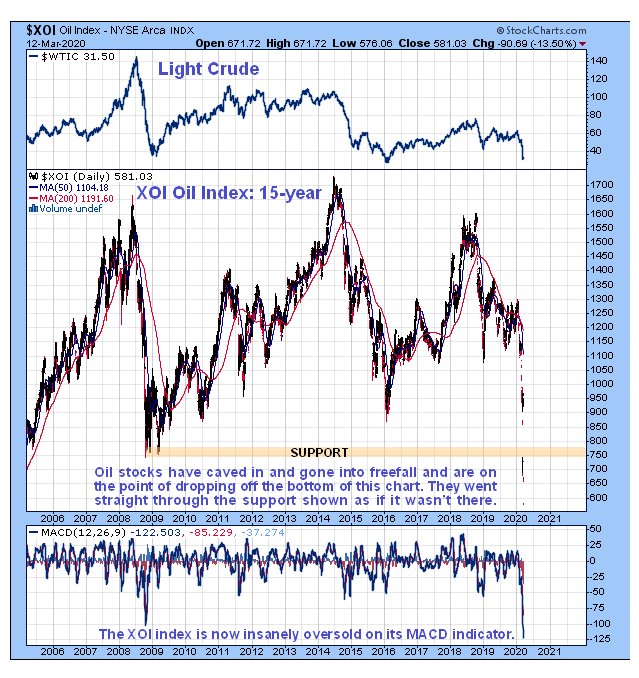 The study of these charts is not intended to be some idle academic exercise, it is directed at all times towards discerning important money making opportunities. Anyone who claims that "charts don't work" might like to reconsider that statement after seeing how we used them to predict the crash, and then Put our money where our mouth is by shorting the Tech sector dead ahead of the crash and just this week tripling our money very fast in GLD Puts, which were sold just yesterday. End of update. Clive Maund March 14th, 2020 support@clivemaund.com Clive Maund is an English technical analyst, holding a diploma from the Society of Technical Analysts, Cambridge and lives in The Lake District, Chile. Visit his subscription website at clivemaund.com .[You can subscribe here]. Clivemaund.com is dedicated to serious investors and traders in the precious metals and energy sectors. I offer my no nonsense, premium analysis to subscribers. Our project is 100% subscriber supported. We take no advertising or incentives from the companies we cover. If you are serious about making some real profits, this site is for you! Happy trading. No responsibility can be accepted for losses that may result as a consequence of trading on the basis of this analysis. Copyright © 2003-2017 CliveMaund. All Rights Reserved. |
| Home :: Archives :: Contact |
MONDAY EDITION June 15th, 2026 © 2026 321energy.com |
|