|
FRIDAY EDITION May 23rd, 2025 |
|
Home :: Archives :: Contact |
|
|
Oil Market UpdateClive Maund support@clivemaund.com January 3rd, 2018 The paradoxical technical situation for oil that we highlighted in the last update has continued - and has gotten even more extreme. In that update we concluded that oil's very bullish volume indicators pointed to its continuing to advance, despite COT and Hedgers charts and sentiment indicators showing extremes that would normally call for a reversal to the downside, and that is what has happened. The reason? - Iran - it looked like the United States and Israel, and possibly client state Saudi Arabia, were building up to an attack on Iran, but just in recent days we are seeing that things are taking a very different turn. Basically there are two ways for the US and Israel to achieve their long cherished goal of neutering Iran. One option is to attack it military, which is relatively easy because it has no nukes and despite its size and population, is unable to defend itself against the kind of onslaught that overtook Iraq, unlike North Korea which has both nukes and the capacity to inflict heavy damage on nearby South Korea in the event it is attacked. This option may be preferable for the Military - Industrial complex because of the lucrative munitions contracts that it would generate. The other option is to foment a revolution, similar to the one that was instigated in the Ukraine a few years ago, to install a pro-Western puppet government, with the "candidates" already lined up before the insurrection starts. The way this works is to get the young people, who are idealistic and impressionable and usually gullible, to turn their backs on their traditional ways and to aspire to Western values, which can be achieved via the internet and Facebook and WhatsApp etc. and then to sow the seeds of discontent, which may be facilitated by the extensive use of clandestine agents infiltrated into the society and the deploying of paid professional agitators. The ground can also be prepared by means of sanctions whose stated purpose is to punish the government of a country, but whose real purpose, which is not stated as it is not politically correct, is to inflict hardship on the population so that they become frustrated and angry and more likely to riot and overthrow the government in a revolution. The end result of this undermining of a society can be explosive, as we saw in the Ukraine and as we are now seeing in Iran. Of the two methods of neutering Iran, we would have to say that this is probably the preferable, because it does not involve such widespread destruction as would be occasioned by a military assault, assuming that is, that the revolutionaries do not go head to head with the ruling clerics and create a civil war scenario. At this point it is simply not known what the current unrest in Iran will lead to, and it may not even be known for sure by the instigators themselves - if the government succeeds in suppressing it, the US and Israel may run out of patience and decide to go for the military option. For this reason no-one can be sure what the ultimate effect on the oil price will be, and this probably explains the paradoxical technical situation we are seeing on the charts and indicators for oil. Turning now to the charts themselves, we see on the 5-year chart for Light Crude that it appears to have broken out of its large Head-and-Shoulders bottom several months ago, but its advance since then has been hesitant and we cannot be absolutely sure that it has broken clear out of this potential base pattern until it has broken clear above its 2015 highs, which is the high following the completion of the Left Shoulder of the pattern. As with copper, that we looked at just yesterday, the strong volume towards the latter part of this pattern and the powerfully rising volume indicators suggest that a major bullmarket is starting, however, we have the conundrum of reconciling this with various indicators which are at extremes and pointing to an imminent reversal to the downside. Action that would reconcile what we are seeing both on the charts and on various indicators would be an intermediate or medium-term correction, followed by renewed advance taking the oil price to new highs. 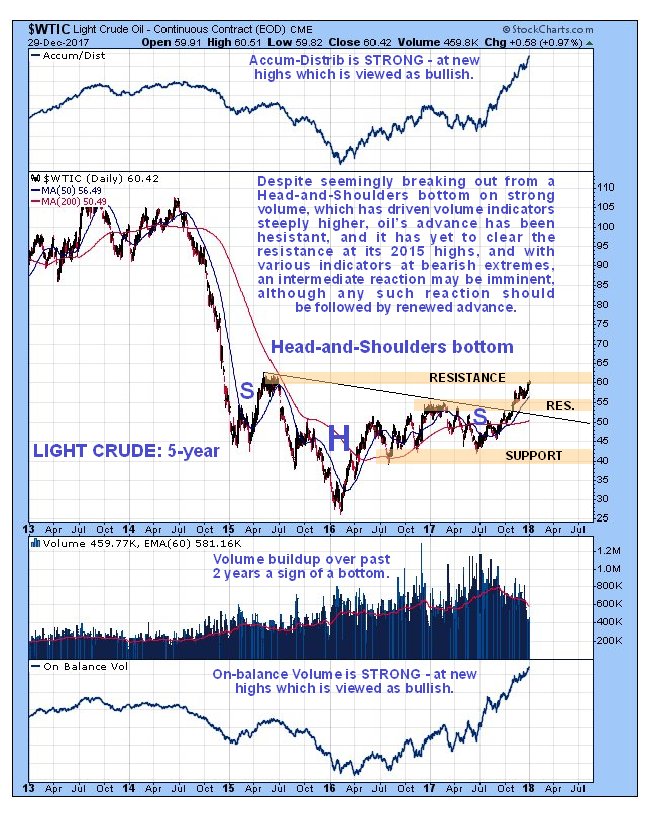 On the 2-year chart for Light Crude we can see one big reason in the price pattern why it might reverse here into an intermediate correction - it has arrived at a significant trendline target in the $60 area. 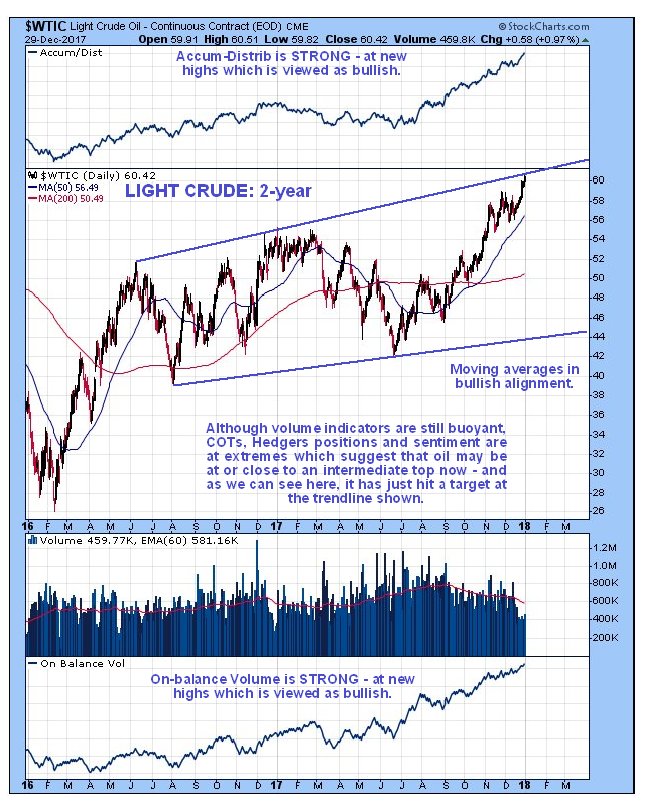 Now we will proceed to look at the indicators which strongly suggest that oil will soon reverse to the downside. We start with its latest COT chart which shows Large Spec long positions at 1-year highs, and since these are the habitual bagholders, this is by itself an invitation for oil to reverse to the downside… 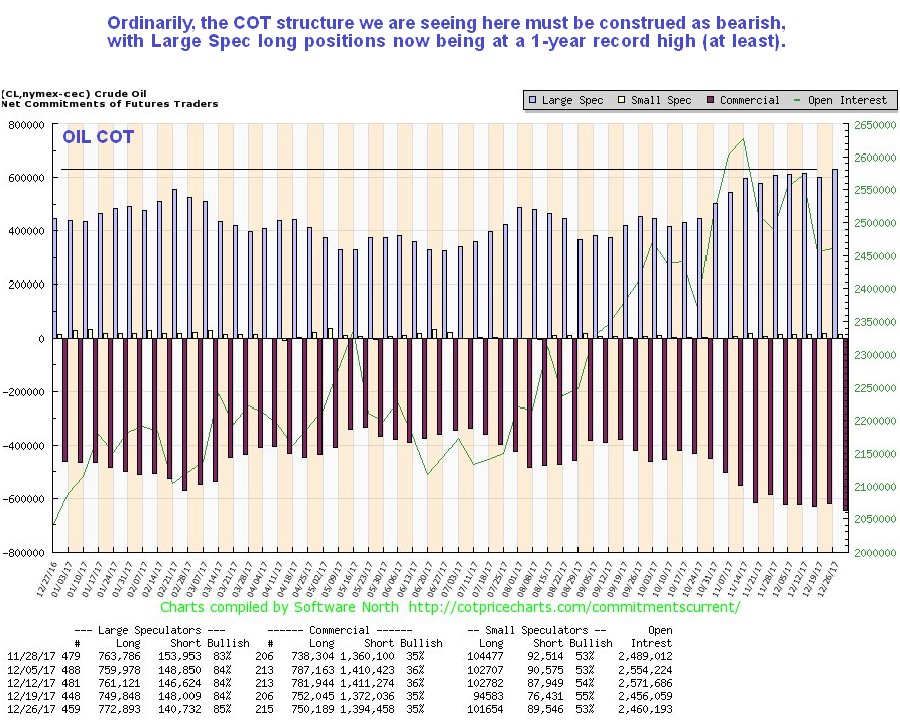 Next we move on to the latest Hedgers chart which shows that Hedgers' positions are now at shocking bearish extremes that have almost always in the past led to a reversal to the downside quite soon after, even if oil makes limited further gains first. 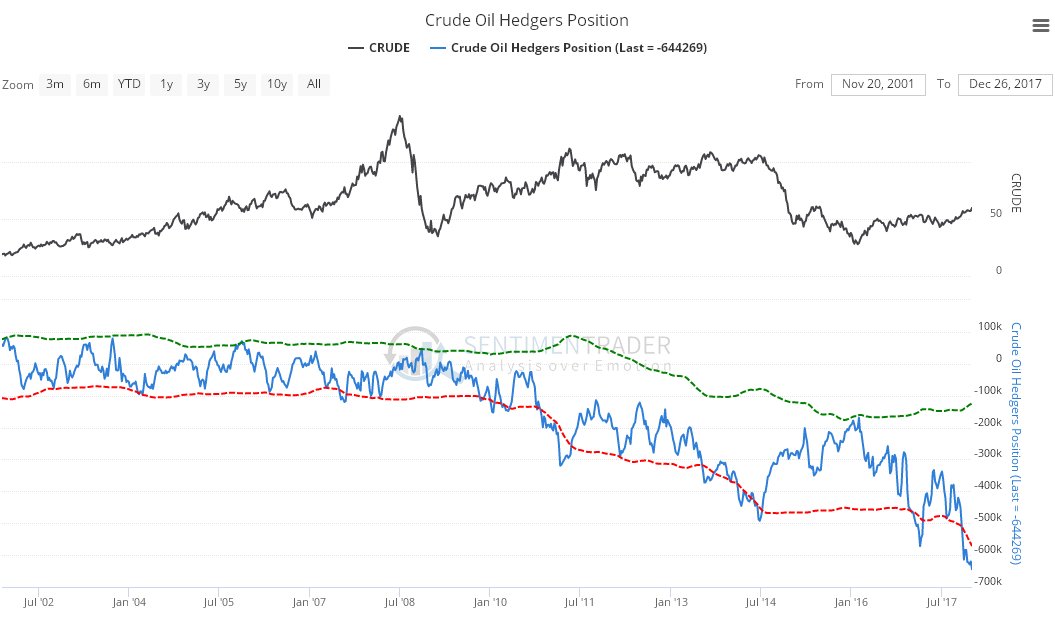 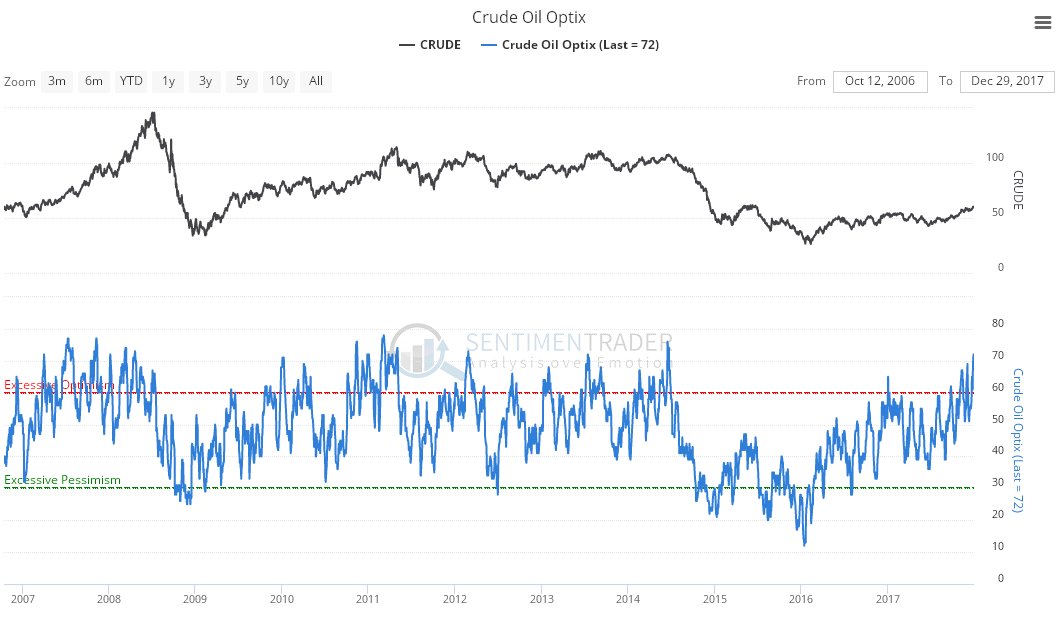  End of update. Clive Maund January 3rd, 2018 support@clivemaund.com Clive Maund is an English technical analyst, holding a diploma from the Society of Technical Analysts, Cambridge and lives in The Lake District, Chile. Visit his subscription website at clivemaund.com .[You can subscribe here]. Clivemaund.com is dedicated to serious investors and traders in the precious metals and energy sectors. I offer my no nonsense, premium analysis to subscribers. Our project is 100% subscriber supported. We take no advertising or incentives from the companies we cover. If you are serious about making some real profits, this site is for you! Happy trading. No responsibility can be accepted for losses that may result as a consequence of trading on the basis of this analysis. Copyright © 2003-2017 CliveMaund. All Rights Reserved. |
| Home :: Archives :: Contact |
FRIDAY EDITION May 23rd, 2025 © 2025 321energy.com |
|