|
TUESDAY EDITION June 9th, 2026 |
|
Home :: Archives :: Contact |
|
|
$29 Uranium and XAU "A-B-C" Wave 2 Bottom
Eddy Gofsky
The price of uranium has recently hit a high of $29 a pound and has sent shock waves across the energy sector. I have been investing in uranium stocks for over 1 year and even I am surprised that the price of uranium is moving so fast. With oil over $50 a barrel and other forms of fossil fuel getting expensive or prone to terrorist attacks in the middle east and Saudi Arabia (please read Robert Baer's book "Sleeping with the Devil" to find out just how vulnerable Saudi Arabia is for a massive terrorist attack on oil infrastructure in an area that is the worlds #1 supplier of oil. 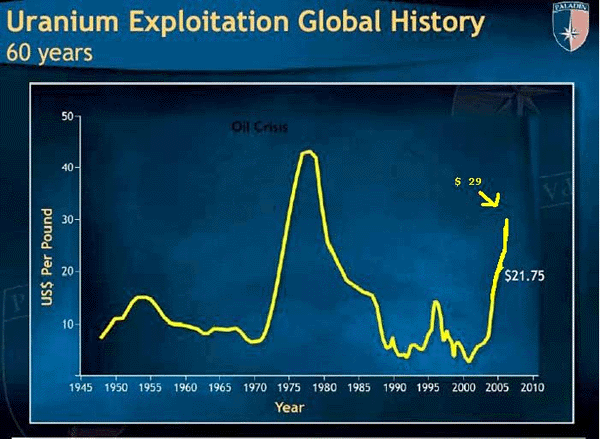 Uranium is just getting started and I really think that the price will explode over the next few years to get some balance back into the uranium market. Because of the huge supply shortage. 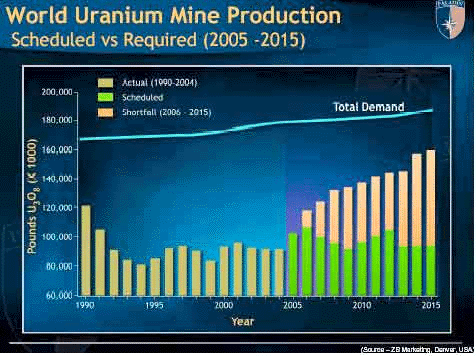 Over the next 10 years it will really pay off to have some uranium stocks in your portfolio to take advantage of this once in a lifetime supply crunch. Once one of these small uranium companies finds a huge deposit their stock price will explode and a mad rush will ensue to find the next big uranium discovery. OilOil looks ready to explode to the upside once it passes through the $58 level. It has formed an awkward head and shoulders bottom pattern with the head of the pattern being a smaller head and shoulders pattern on a smaller fractal scale. The pattern is bullish and has potential to reach $70 by late summer. 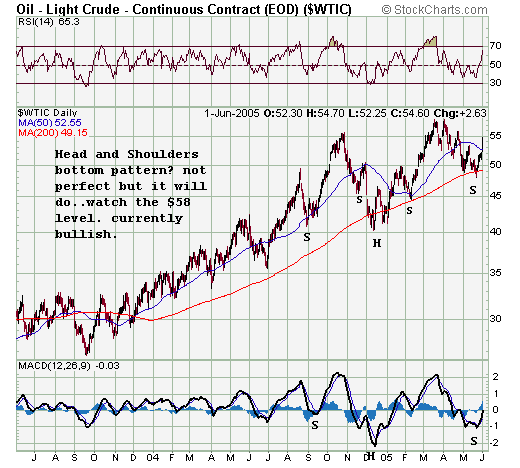 XAUIt looks like the wave (2) bottom in the XAU that I have been looking for has finally happened. Motive waves are the easiest to see on the chart, the classic 5 wave Elliott pattern. But it is the corrections that follow the 5 wave impulse patterns that are so hard to figure out, most of the time the true pattern will only show itself until after it has competed itself. This 5 year chart of the XAU gold index is a text book perfect example of a classic ABC flat correction. Anyone who owns Robert Prechters ground breaking book "Elliott Wave Principle" (which was written in the late 1970's at the top of the last gold bull market) can simply turn to page 45 for a complete description of an Elliott wave flat correction. Also the C wave bottom also marks the end of wave (2) and the start of wave (3) which author and Elliott wave practitioner Steven W. Poser likes to describe them as "The 3rd wave is the wave that elliotticians dream about". With general psychology in the gold stock sector very negative there is every indication that a wave C of (2) has been put in place. 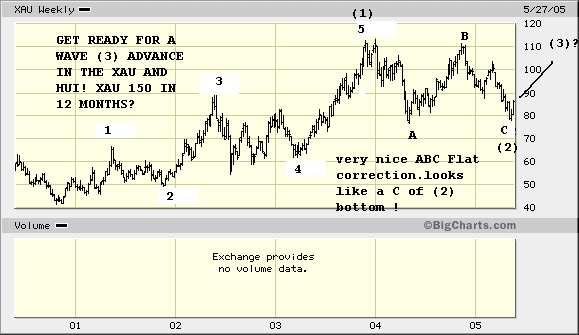 Let's go back into some of the Elliott wave text books and take a look at Wave 2 bottoms. P.77 of "The Elliott Wave Principle". "Second waves often retrace so much of wave one that most of the profits gained up to that time are eroded away by the time it ends. This is especially true of call options purchases, as premiums sink drastically in the environment of fear during second waves. At this point, investors are thoroughly convinced that the bear market is back to stay. Second waves often end on very low volume and volatility, indicating a drying up of selling pressure". P.15 of "Applying Elliott Wave Theory Profitably". " This leg will lead all brilliant analysts to boldly announce that they "told you so." Victory is at hand for the bears as the trend lower resumes. Unfortunately, defeat shall be snatched from the jaws of victory as prices never take out the previous lows. The drop should be in 3 waves (remember that if we get an A-B-C zigzag down, wave A would still develop in five waves, but the retrace amount of wave 1 should be rater small by the time wave A completes). Volume should be lower than it was during wave 1. Prices typically retrace 38% to 62% of the losses, and will often convince the crowds that the previous down trend is alive and well. If we are fighting off a major, entrenched bear market, or alternatively, are working on a very short time frame, the retrace can easily exceed 62 percent. Wave 2 can never retrace more than 100% of Wave 1. There are no exceptions to this rule; in general, if prices retrace more than 62%, there is high risk that you count is incorrect and that the bear market is actually alive. I truly believe that we have already seen the Wave C of 2 bottom in the XAU and that we are in the very early stages of a huge Wave 3 advance that should take us to 150 in the XAU. Just remember that gold stocks are very explosive and can catch fire at anytime. As you can see in the 20 year chart of the XAU below in late 1986 with the XAU at 60 it only took about 1 year for the index to rocket up to 150. The same goes for 1993 when again the XAU went from around 60 to 150 in 1 year. I think we are at a similar time right now where the XAU could make it to 150 sometime in 2006. 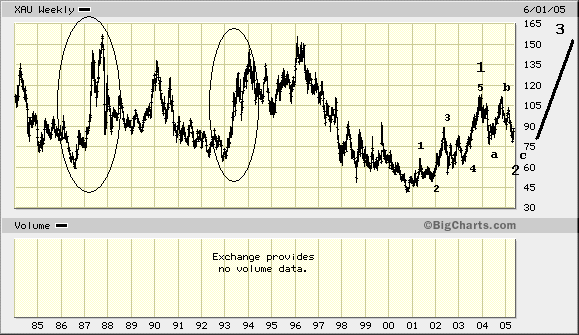 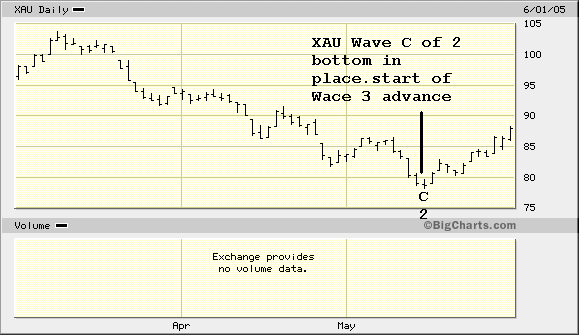 On April 14 2005 there was an essay that was posted on Financial Sense Online by Frank Barbera who had some of the best Elliott Wave charts of gold and gold stocks that I have seen. His essay (The Coming Bull Market in Gold Stocks) is a must read for every gold stock investor or Elliott Wave student. His essay had 1 chart that I have been trying to find for years. The chart is a gold stock index going back to 1915. The chart clearly shows a developing five wave Elliott pattern in the gold stock index with wave 4 bottoming in 2001 which means that we are in the early stages of a huge wave 5 blow off top advance that could last for another 10 years. Why so long you ask? Well by looking at the 90 year old chart you can see that the 2 previous gold stock bull markets, Wave 1 was (1917-1939) and Wave 3 was (1959-1980). These two bull markets Wave 1 and Wave 3 where both around 20 years long, so if the wave 4 bottom in gold stocks was in 2001 then you could see rising gold stocks well into the next decade. What is the Elliott Wave Principle and why do follow it and think it's the most valuable tool for every investor? Here is the best description of Elliott Wave Theory that I tell people. Page: 121. of Robert Prechter's 1978 book "Elliott Wave Principle." "In its broadest sense, the Wave Principle suggests the idea that the same law that shapes living creatures and galaxies is inherent in the spirit and activities of men en masse. Because the stock market is the most meticulously tabulated reflector of mass psychology in the world, its data produce an excellent recording of man's social psychological states and trends. This record of the fluctuating self-evaluation of social man's own productive enterprise makes manifest specific patterns of progress and regress. What the Wave Principle says is that mankind's progress (of which the stock market is a popularly determined valuation) does not occur in a straight line, does not occur randomly, and does not occur cyclically. Rather, progress takes place in a "three steps forward, two steps back" fashion, a form that nature prefers. More grandly, as the activities of social man is linked to the Fibonacci sequence and the spiral pattern of progression; it is apparently no exception to the general law of ordered growth in the universe. In our opinion, the parallels between the Wave Principle and other natural phenomena are too great to be dismissed as just so much nonsense. On the balance of probabilities, we have come to the conclusion that there is a principle, everywhere present, giving shape to social affairs, and that Einstein knew what he was talking about when he said, "God does not play dice with the universe." The stock market is no exception, as mass behavior is undeniably linked to a law that can be studied and defined. The briefest way to express this principle is a simple mathematical statement: the 1.618 ratio. The Desiderata, by poet Max Ehrmann, reads, "You are a child of the universe, no less than the trees and the stars; you have a right to be here. And whether or not it is clear to you, no doubt the universe is unfolding as it should." Order in life? Yes. Order in the stock market? Apparently." You can e-mail me at eddy_gofsky@yahoo.com Or you can visit my website http://www.edwardgofsky.com/ --Edward Gofsky Edward Gofsky lives in Vancouver B.C, Canada where he studies Elliott Wave Theory and Classical Technical Analysis.Copyright ©2005 Edward Gofsky. All Rights Reserved. |
| Home :: Archives :: Contact |
TUESDAY EDITION June 9th, 2026 © 2026 321energy.com |
|