|
WEDNESDAY EDITION June 24th, 2026 |
|
Home :: Archives :: Contact |
|
|
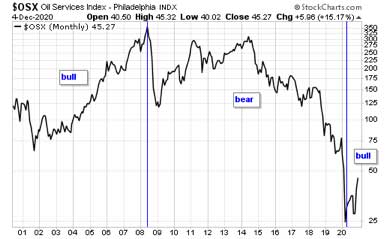
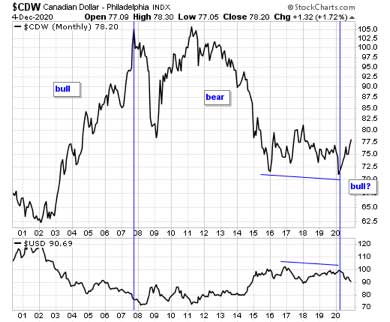
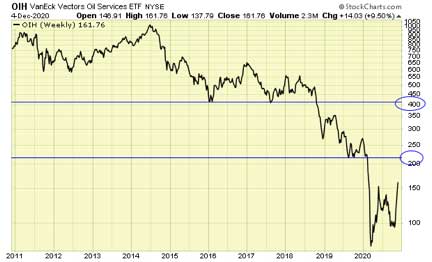
Special energy reportBy Jack Chan at www.simplyprofits.org December 8th, 2020 We have been avoiding this sector much of the time since oil prices topped in 2008. It's been a brutal bear market for twelve years, and it may have finally ended this year during the COVID19 pandemic. Let's look at the supporting evidences. 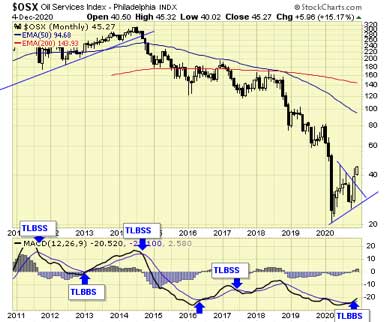 First and foremost, our long term trading model confirms a major buy signal today. The oil services index has lost more than 90% of its value since topping in 2008. This 12 year brutal bear market may have ended this year during the COVID19 pandemic panic sell off. 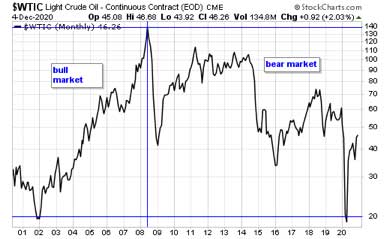
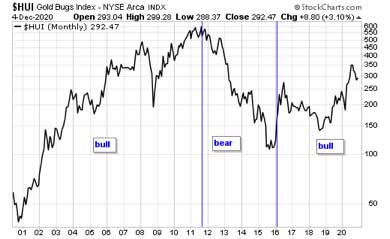 How did gold stocks perform during these time frames?
 Long from 103.50, 10% allocation. 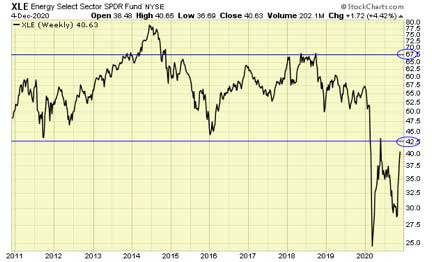 Long from 30.44, 10% allocation. . 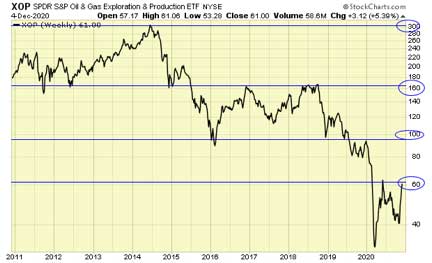 Long from 44.62, 10% allocation. . 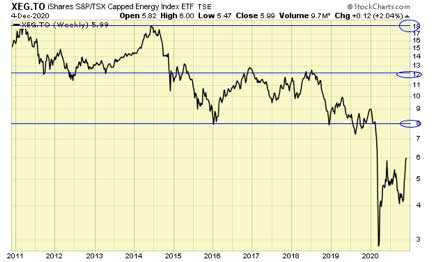 Long from 4.40, 10% allocation. . Summary We cannot predict, but we can prepare. Current supporting evidences suggest that the 12 year bear market in the energy sector may have ended this year during the pandemic liquidation. We have allocated 40% of our capital to this sector during the recent cycle bottom, and all positions are firmly in the black. New money can buy/accumulate at the next cycle bottom, but of course you may have to wait for the cycle to top first. If you are uninvested, you can tiptoe into the market by initiating some positions when the short term is oversold during pullbacks. I point out the short term overbought/oversold conditions in all three sectors in my daily email messages. This sector, like the gold sector can be very volatile and has sharp short term swings, reacting to news events. I hold these positions without stops, and I am constantly mentally prepared for sudden sharp price movements. Energy /oil stocks and ETFs have been beaten down in a long grinding bear market for 12 years. Is our current new long term buy signal a generational buying opportunity? You make the call. End of update December 8th, 2020 |
| Home :: Archives :: Contact |
WEDNESDAY EDITION June 24th, 2026 © 2026 321energy.com |
|