|
TUESDAY EDITION June 16th, 2026 |
|
Home :: Archives :: Contact |
|
|
Case study : ECAJack Chan Our service is to provide entries and exits to the three sectors of metals, energy, and technology for both investors and traders, using funds and ETFs, for simple execution, low maintenance management, and most of all, diversification. However, individuals with high net worth may wish to expand their exposure to include individual stocks, and as an extended benefit to our loyal subscribers, we can provide a case study of these stocks, time permitting, in a “bottom up” approach. What is a “bottom up” approach?
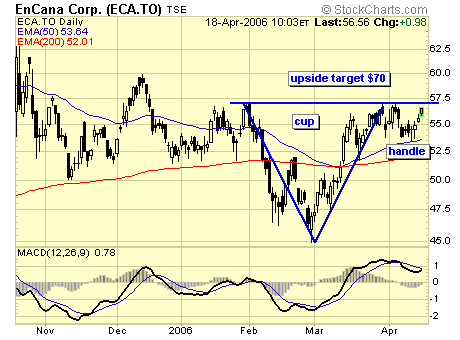
ECA.TO – daily chart, short term.
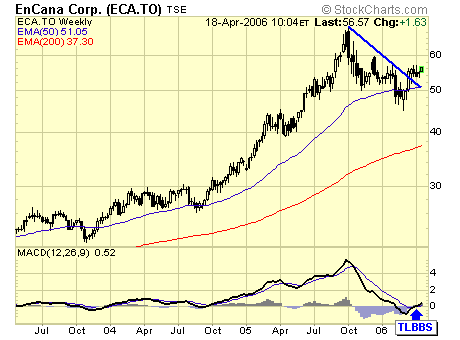
ECA.TO – weekly chart, intermediate time frame. Monthly chart is unavailable due to lack of data.
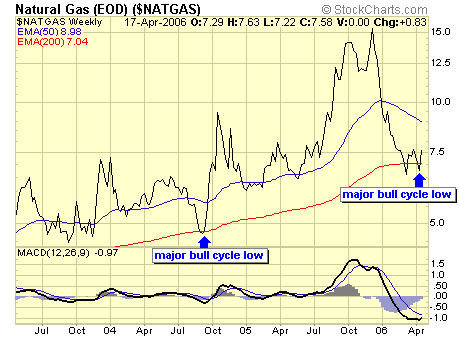
The 35% correction in ECA was a direct result of plunging natural gas prices. However, natgas appears to have found support at the weekly 200ema, and is now completing the bottoming process of a major bull market cycle low. Summary With natgas stabilizing after a plunge of more than 50%, oil and gas stocks such as ECA has firmed up considerably, and now at the point of a breakout to a potential 20 to 30% gain for the near future. With risk at 4%, this is a very attractive opportunity for both traders and investors. Disclosure: staff and employees at Traderscorporation.com may or may not own shares of ECA, this technical analysis does not take into consideration of fundamentals which are company specific. Due diligence is required.
April 19th, 2006 |
| Home :: Archives :: Contact |
TUESDAY EDITION June 16th, 2026 © 2026 321energy.com |
|