|
WEDNESDAY EDITION June 24th, 2026 |
|
Home :: Archives :: Contact |
|
|
Energy UpdateBy Jack Chan at www.simplyprofits.org March 23rd, 2021 Signals and set ups Investors During a long term buy signal, investors can accumulate positions by cost averaging at cycle bottoms, ideally when prices are at or near the daily 200ema. During a long term sell signal, investors should be hedged or in cash. Traders Simply buy and sell upon buy/sell signals on the daily charts, or cost average in at cycle bottoms when prices are at or near the daily 200ema; and cost average out at cycle tops when prices are above the daily 50ema. Allocations Will be conservative when volatility is high, and aggressive when volatility is low. Current signals 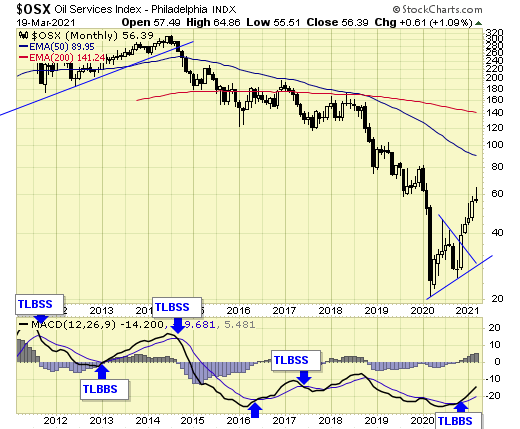 Long term - on BUY signal Short term - on sell signals A correction is in progress. 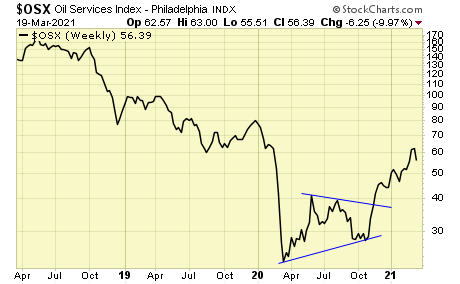 The trend is up. 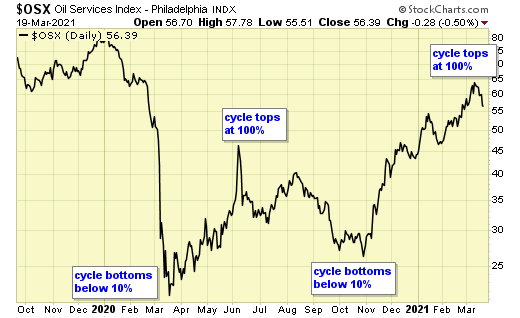 But the cycle has topped, and a correction is in progress. 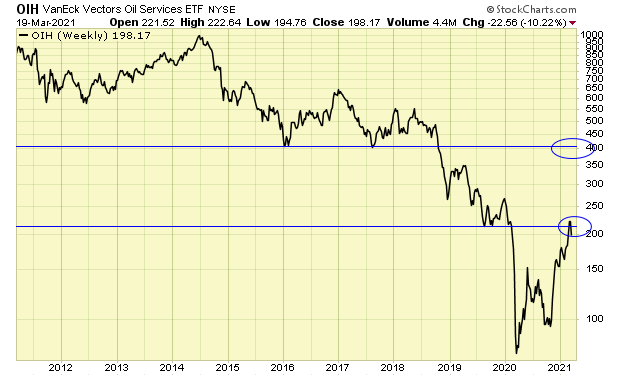 OIH is at resistance. 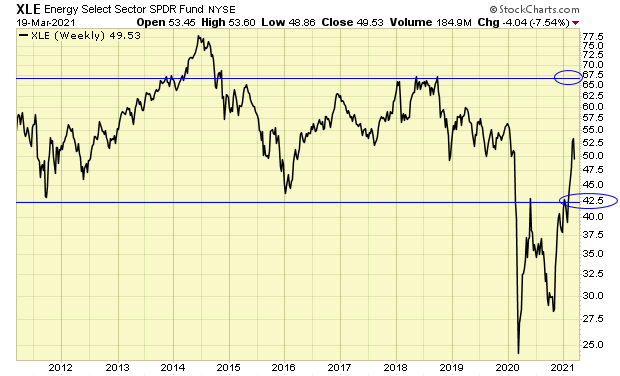 XLE has support at $42. 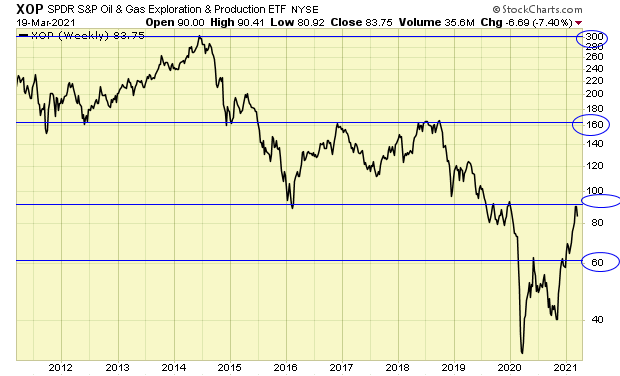 XOP is at resistance. 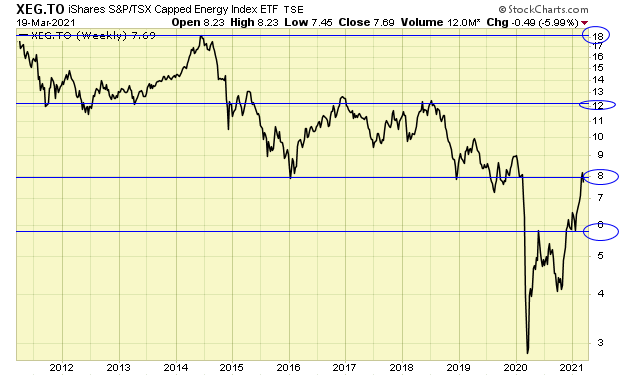 XEG.TO is at resistance. Summary Long term (monthly chart) - on BUY signal. Short term (daily chart) - on sell signals. Cycle is down and a correction is in progress. We took nice profits on OIH and XOP, and holding XLE and XEG.to as core positions for the long term. We will allocate more capital to the sector upon the completion of the correction. End of update March 23rd, 2021 Jack Chan is the editor of Simply Profits at www.simplyprofits.org, established in 2006. Jack bought his first mining stock, Hoko Exploration in 1979, and has been active in the markets for the past 40 years. Technical analysis has helped him filter out the noise and focus on the when, and leaving the why to the fundamental analysts. His proprietary trading models have enabled him to identify the Nasdaq top in 2000, the new gold bull market in 2001, the stock market top in 2007, the US dollar bottom in 2011, and most recently, overweighing in bonds over stocks in 2019 before COVID19 became a household name. In his spare time, Jack is an avid golfer and tennis player, and volunteers his time coaching and lecturing at local clubs and universities. |
| Home :: Archives :: Contact |
WEDNESDAY EDITION June 24th, 2026 © 2026 321energy.com |
|