|
TUESDAY EDITION June 9th, 2026 |
|
Home :: Archives :: Contact |
|
|
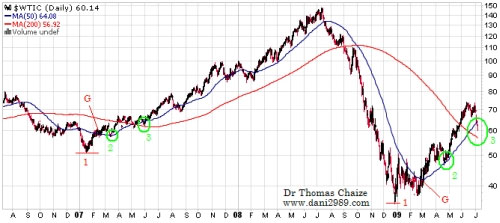
Oil Prices in Short Term Dr Thomas Chaize July 11th, 2009 Email: dani2989@voila.fr www.dani2989.com This is my 4th technical analysis in the short term since March 2009 on the price of oil, I hope it will have the same success as the previous three tests. Usually the short term interests me little, I prefer the big long-term trends. But beginning in 2009 the short term and long term are given appointments in the area of $ 30 and it was difficult not to write about it. Similar 2007 and 2009 (1) : The bottom is reached in early 2007 and late December 2008 (red line 1). (2) : The price of a barrel of oil back test the moving average 50 days after being passed over. (green circle 2). (3) : After crossing the moving average 50 days and 200 days which is a golden cross in the price of oil back test the moving average 50 days and 200 days.
(G) : The similarity is such that even my two reports on paying geothermics were published in very similar.
Important phase
The current price level is very important to monitor:
The current area is attractive to make "oil purchases"
with stops in major thresholds, keeping one hand on the mouse, one eye
on the graph of oil to make sure everything happens as in 2007 and not
forgetting monitor validation beautiful double top that built the
natural gas to 3.3 $.
Dr Thomas Chaize This analysis is available for members of the mailing list free site Dr.Thomas Chaize. |
| Home :: Archives :: Contact |
TUESDAY EDITION June 9th, 2026 © 2026 321energy.com |
|