|
THURSDAY EDITION March 26th, 2026 |
|
Home :: Archives :: Contact |
|
|
Oil and Economic Theory: Some Chronological and Mathematical AspectsProfessor Ferdinand E. Banksferdinand.banks@telia.com November 3rd, 2010 Abstract: The goal of this paper is to expand my recent lectures in Uppsala and Paris, and to preview some arguments in my forthcoming introductory energy economics textbook (2011). The chronology is more important than the mathematics, and some of the latter can be skipped by uninterested readers. Here I suggest that readers desiring more insight into various energy resources should turn to the work of Professor Kjell Aleklett and his brilliant team at the Global Energy Systems Institute (in the Department of Physics), Uppsala University, particularly Mikael Höök (2010), Bengt Söderbergh (2010), Fredrik Robelius (2007) and Kristofer Jakobsson, (2009). Professor Aleklett's institute has been correctly called the most productive academic energy research institute in Europe. This paper features a chronological listing and explanation of various crucial energy events that all my future students must learn perfectly, beginning with Harold Hotelling's essay (1931), and culminating with events that led me to conclude that the strategy of the Organization of Petroleum Exporting Countries (OPEC) is now the most important factor in pricing conventional crude oil. Another key issue was one touched on by Professor Jean-Marie Chevalier and his students at the leading academic energy economics faculty in Paris (GCEMP, the University of Paris, Dauphine), which had to do with various financial issues in the matter of pricing oil. 1. 1931 AND 1974: EXAMINING A FUNDAMENTAL RELATIONSHIP FOR THE PRICING OF AN EXHAUSTIBLE NATURAL RESOURCE (I.E. OIL) The fundamental mathematical relationship referred to in this section is associated with the brilliant economist, Professor Harold Hotelling (1931), and re-examined shortly after the first oil price 'shock' by a Nobel laureate, Professor Robert Solow (1974). Even so, I contend that this relationship is pedagogically misleading, and consequently I do not encourage my students to discuss it in classroom situations. For example, after lecturing on oil in the Danish Parliament a number of years ago, I encountered a teacher of energy economics who soothed my annoyance at the attention paid the many irrelevant extensions of Hotelling's work by informing me that "if we did not teach nonsense in our courses in resource economics, then what could we teach". What indeed? The item to which he was referring was the famous expression ?p/p = r, where p is the price of an exhaustible resource, and r the prevailing rate of interest. It can be derived using the kind of algebra taught the freshman class at Boston Public, or with the aid of some financial economics, or as I do below by formulating an orthodox profit maximizing relationship of the kind featured in advanced undergraduate economic theory, but whose relevance is drastically transformed by assuming that the marginal cost of production is constant. The expression is given just below: 
In the first parenthesis we have profits in period 't', which are defined as usual as revenue (price times quantity, or ptqt) minus 'cost' (average cost times quantity, or ctqt). In the third paragraph we have the given amount of the resource (e.g. oil), R*, at the beginning of the period designated t = 1, distributed over N periods (q1 + q2 +…..+ qN ? R* ). The second parenthesis, (1+r)-t, merely discounts the profit in period 't': profits in later periods have less value than those of the same amount in earlier periods. In conventional presentations N is taken as given, and in the Hotelling article (and many others) 'ct' is regarded as a constant (e.g. ct = c) that is equal to both average and marginal cost for the N periods. Furthermore 'pt' is the expected price for the period 't', (although the actual price for t =1), and the implicit assumption is that these prices as well as the amount of the resource (R*) are correctly forecast at the beginning of the current period. ? is a Lagrangian multiplier, and denotes the scarcity value of the resource: e.g. ? is zero if R* exceeds the amount of the resource extracted during the N periods (because then the resource is not scarce). Put another way, ? = ?V/?R*. Next we are going to obtain the Hotelling result from equation (1). What we do is to differentiate V partially with respect to the values of qt, and set these values equal to zero (?V/?q1 = 0, ?V/?q2 = 0…?V/?qN = 0). Then, manipulating slightly, we obtain ?p/p = r for successive periods. Please note however that by taking this approach, we explicitly replace p in the previous expression by the 'net' price, or price minus the marginal cost (pt - c). We also observe that this net price increases at the rate r. I continue by citing Albert Einstein's 'equivalence theorem' (or 'principle'): If two phenomena display equivalent effects (e.g. ?p/p = r, and equation (1)), then they must be manifestations of the same fundamental laws. But as the directors of BP and Exxon might explain to you if politely asked, ct is NOT constant and equal to the marginal cost for real world oil deposits. Instead, deposit pressure decreases and costs tend to increase as cumulative output increases (and thus reserves decrease), where by costs I am specifically referring to average and marginal costs (as well as total costs). Accordingly, in these circumstances, we would not get ?p/p = r from a properly formulated real world profit maximizing exercise. Put another way, we do not have the same fundamental laws operating in the real world as we do in class and seminar rooms, where teachers are sometimes inclined to present showy bunkum to their students. For example, when discussing real world oil deposits, ?p/p = r is useless. I can also mention that in the 1980s some OPEC directors openly cursed the Hotelling relationship for its inaccuracy. They had actually believed that in this best of all possible worlds, the oil price was going to increase annually by whatever the value of 'r' happened to be. (Something that needs to be appreciated here is that deposit pressure also falls due to 'natural depletion', which in mainstream capital theory would be called 'depreciation by evaporation', and is discussed with a numerical example in my forthcoming textbook.) By way of repairing (1), ct = c is rejected, and I suggest that we write ct = ct(qt; Rt), where Rt is the amount of reserves at time 't'(which decreases as production takes place). How can we describe the development of Rt? One way is to use a logistic function of the type that will be derived below, in which e.g. RT = R* ? ?qt, with R* as the initial amount of reserves, and the summation running from the initial period (t = 1) to the beginning of. t = T, where T ? N. For future students and teachers of energy economics, I suggest that this exercise should be carried out in terms of words and a few numbers, rather than the words and music (i.e. complex mathematics) I employed in my energy economics courses in Grenoble (France) and Stockholm (Sweden), and which the gentleman I unfortunately worked for in Bangkok found too strenuous. Can we get anything at all usable out of the original Hotelling relationship (?p/p = r), despite what I am prone to call its "limited scientific value?" If we write it out we obtain pt+1 = (1 + r)pt , assuming that we are dealing with a two period situation (e.g. t and t+1), and the prices are interpreted as 'net' prices (pt - c). Then pt+1 might be the price at the beginning of the 'next' period, and so is an estimated price. The logic behind this expression specifies that if the right hand side of this relationship is larger than the left hand side, then the next unit of oil should be produced now, and used to purchase a financial asset having an interest rate of r. That option can be refined to mean a financial asset or e.g. a trip to a Stockholm jazz club, or a combination of the two. If the left hand side however is greater than the right hand side, then the unit of oil in question is left in the ground, and presumably produced in a later period. Equilibrium comes about when the two sides are equal. I discuss this at some length in my first textbook (2000), but I lack any particular fondness for my explanation or the explanations of anybody else, since the expression "equilibrium" is strictly an academic departure in the context of oil. However, I can remember talking to several Norwegian gentlemen who told me - employing what was once called gutter language - that it was insane for Norway to continue to produce the same amount of oil as earlier when the oil price fell to $10/b - unless of course the decision makers in Norway were obtaining their lessons in energy economics from pundits in the employ of that compendium of London wine bar wisdom, The Economist, who considered $10 a righteous price. Note the expression "economically insane". Politically and socially, holding oil production constant might have made a great deal of sense, assuming that Norwegian decision makers were intent on being royally wined and dined on the occasion of their next visit to the United States or some other large oil importing country. 2. 1960 - 1973: FROM OPEC'S FORMATION TO THE 1ST OIL PRICE SHOCK This is an important interval, though often ignored by many academic energy economists. In 1960 a group of oil exporting countries followed an example set by oil producers in Texas (U.S.), who had formed a cartel for the purpose of limiting output, and therefore keeping the price of oil from falling to a few cents a barrel. In case readers are curious, the man often called the best brain of the 20th Century, John von Neumann, once said that collusion by firms is the only way that the joint profits of a cartel can be maximized (otherwise, as you remember from your courses in game theory, producers face the problem of "conjectural reaction" - that is, having the optimal oligopolistic production arrangement upset by competition). OPEC's ambitions were also in the direction of control as well as cooperation, because the wording in the 'Document of Intent' they published in l967 definitely implied that when they felt the time was right, they would take complete responsibility for the oil produced within their borders. And then, in 1962, Dr M. King Hubbert expanded some of his previous work by insisting that oil production in the 'lower' 48 (states) of the United States would peak in l970 or l971. This contention was ridiculed by the same kind of people who claim today that a global peak will not take place, however the actual peak in the U.S. came late in l970. Output peaked at about 9.5 million barrels per day (= 9.5 mb/d), and almost immediately began to decline (instead of forming a plateau). It declined (for the entire U.S.) until the super-giant Prudhoe deposit in Alaska came on stream, at which time it turned up. But output never attained its previous peak. Instead it reached 7.5 mb/d, and began to fall again again. Today output for the entire U.S. is somewhat less than 6 mb/d. Hubbert's thinking must have gone as follows. The more oil (reserves) in a particular plot of earth, i.e. a deposit, the easier they are to extract. After a while though, oil becomes more difficult to extract, which is primarily due to a decline in deposit pressure, which in turn might be influenced negatively by an increase in natural depreciation. Eventually a natural production limit is approached that is set by the influence on deposit pressure of the amount of the resource (i.e. oil) remaining in the deposit. As designated earlier, the resource ceiling is R*. This is the estimated quantity (in barrels) of reserves in a deposit, region or globally, depending upon the object of the exercise. And note, reserves are less than oil in place - sometimes a great deal less. It does not take a background in mathematical economics to suggest that what we have thus far 'might' be presented by the simple equation dR/dt = ?(R* ? R), where R is reserves extracted, and dR/dt is the change in reserves being extracted per unit of time, as the deposit goes toward exhaustion. As for ?, on this occasion it is a constant (and not a Lagrangian), and in the derivation below takes the form of the initial depreciation rate of reserves. dR/dt is production from the deposit, or q units per time period, but this can be overlooked at present because while the above equation might be interesting in an unsophisticated context, it does not lead to the 'bell' (or 'normal-like') curve associated with output from a typical oil deposit over a long time period. The beauty of the logistic equation is in justifying its use on the basis of economics, and not just because it generates a recognizable piece of geometry, but it is not so beautiful that readers uninterested in mathematics should spend time deciphering its charms. As with the theory of economic growth, what has to be done is to work with rates rather than the derivative. Using the same symbols as above, the expression that will be employed as the first step in the derivation of the logistic equation is given in (2): 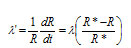
Now for a key recognition. First of all, when R ? 0, then ?' ? ?, but when R ? R* - or the amount of the deposit that has been extracted is approximately equal to the amount available (R*) - then ?' ? 0, because there is no more to extract. . Clearly, as R increases, then ?' - the rate at which exhaustion is taking place - decreases. At this point it might be useful to recognize that ?' is also analogous to a growth rate: it is the rate at which the deposit is being depleted, and it declines as reserves are exhausted. Observe that instead of using (R* ? R) on the right hand side of (1), I used [(R* ? R)/R*]. This was necessary in order for the units on both sides of the equation to match. As noted, ? is analogous to a growth rate, and ceteris paribus can be taken as constant, but [(R* ? R)/R*] = [1 - (R/R*)] is a 'damping factor' that is directly related to the limit put on production by the availability of the resource: it reduces ?'. A problem with (2) is that it does not look like the logistic equations you see in your favourite mathematics book, and so it will have to be adjusted. Doing this is uncomplicated and involves no more than treating (2) as a differential equation. Then we get: 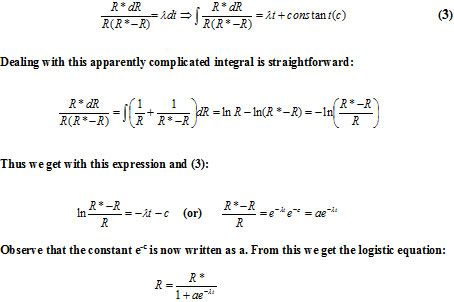
Since dR/dt = q, it is a simple matter to derive a Bell-like curve from (4), particularly when a few more manipulations yield the curve's inflection point, which is R' = R*/2 and t' = 2 ln a. This inflection point is the maximum for the Bell-like curve, and returning to the previous discussion, Hubbert's t' was 1970. A great deal of the subsequent discussion about applying Hubbert's work to the entire world had to do with the value of R*. Persons who want to believe that there is plenty of oil in the crust of the earth, claim that t' would not be soon, because as far as they are concerned, R* is extremely large. Something that deserves more attention than it has received is the peaking in 1965 of global conventional oil discovery. The important thing here is that - as pointed out by Professor Aleklett and Colin Campbell - the peaking of world oil output will in some respects be an analogue of the peaking of world oil discovery. The eventual peaking of world oil output will likely be a very serious matter, both economically and psychologically, and not just the kind of pseudo catastrophe that best describes some early assessments of the nationalizations of foreign oil producing assets in e.g. the Middle East. These nationalizations began in October, l973, and the reason for my assertion is that before nationalization, the foreign enterprises operating in e.g. Saudi Arabia had planned to raise production from 10 mb/d to 20 mb/d. If production had actually been raised to 20 mb/d and maintained at that level for as long as possible, we might already have experienced a peaking of global output. Producing 20 mb/d did not, however, coincide with the strategy of the government of Saudi Arabia, whose king clearly stated that Saudi production would not exceed 10 mb/d. The same promise surfaced in 2008, when the oil price soared to over $147/b, and the president of the United States flew to Saudi Arabia for the purpose of convincing the Saudi king to raise output. The answer to his request was an unequivocal but respectful no, and here readers should carefully note that had President Bush and his skilful and intelligent advisors genuinely believed that speculators and not oil fundamentals (i.e. supply and demand) were the cause of the oil price escalation, he could merely have taken an interstate bus to New York, and once there, ordered Wall Street's 'masters of the universe' to cancel any socially harmful financial schemes they were contemplating . The first oil price shock caused the oil price to increase by a factor of slightly more than five (from $2.05 to $10.35), but shortly afterward the price showed a tendency to decline. A price rise of that nature has been termed a 'spike', and there were two more pronounced spikes and a tame spike before the sustained price rise that began in 2003-2004, and accelerated during 2007-08. The thing to appreciate here is that speculators were just as eager to become rich during those spikes as they purportedly were when the oil price went into orbit in 2008, but sadly those who stayed too long at the party took a fall, because during all the spikes in the 20th century, there was plenty of high quality crude oil in the crust of the earth, and much of it was located in the right place. There was of course considerable price volatility on both upward and downward trends during this period, but to a considerable extent this was merely a side-show or distraction. In my talk at Uppsala I was questioned about the dynamics of price surges, and I probably suggested that these could be approached using the same mathematics as employed when discussing non-fuel minerals or some agricultural products. But while we can easily obtain trends and assorted vibrations from some elementary difference and differential equations, this is mostly a mathematical rather than an economics exercise. It looks good on a backboard, but does not say a great deal. Here it might be suitable to cite a useful observation by Robert Feldman, chief economist of Morgan Stanley. He stated that time lags between supply and demand that characterized the famous hog cycles of the l930s are now at work in "energy" (by which he probably meant oil). These time lags can create imbalances that lead to very large price swings. These lags can be detected in equations (5) and (6) just below, although what is not shown in these expressions are the root causes of fluctuations. These are speculative tides of bullishness and bearishness, which have their origin in actual and/or expected price trends, the outcome of OPEC meetings, and possibly the forecasts of high status organizations such as the International Energy Agency (IEA) and the Energy Information Agency of the United States Department of Energy. Of course, as Kristofer Jakobsson and his colleagues have made clear (2009), the less said about the forecasts of the IEA the better, and I made sure that my students in Bangkok understood this. We can now derive a simple equation which might have some pedagogical value, however it is not an essential part of this exposition. First we have a (flow) demand curve for oil ht = a0 + aPt , and a (flow) supply curve st = b0 + bPt-1, with a<0 and b>0. Notice that the supply curve is lagged, while the demand curve is called 'h' instead of the usual 'd', and I will add trend terms to these relationships to get ht = a0 + aPt + ?t and st = b0 + bPt-1 + ?t. Introducing the equilibrium condition st = ht we immediately obtain the following difference equation. 
(For ?t and ?t we might have ?t = ?x + ?1t and ?t = ?y + ?1t.) In any event, if we begin with a price of P0, then the solution of the above equation is obviously: 
The expression to the left of the plus sign in (6) represents a cobweb model, while the expression to the right is a trend term for the price. On the basis of earlier statements, at the present time ?t is less than ?t, and so Pt is trending upward. Basically in (6) there is a trend term around which there are oscillations in both price and inventories. In addition, if supply lags demand, and there is an upward spike in demand, inventories will decrease even if the lag is very short. For an optimal presentation however, a flow model of the type above is inadequate: it requires too much interpretation. The trend terms in the equations suggest that we are dealing with the long term, while even the discussions on CNN and Bloomberg suggest the relevance of inventories for short term developments. Thus we need another model - one in which inventories are explicit. That means a stock-flow construction of the kind that will be presented in the next section. One thing remains in this section. This is to mention that while for several decades the key issue with OPEC was their production, their exports have now become just as important. Those countries are raising the domestic 'consumption' of their oil (and gas), just as you or I would if we were in their place. In some cases they are concerned with adding value to oil with refining and petrochemical activities, rather than to export it in the crude form. This shows that they have grasped some of the key lessons of development economics, and particular the lessons taught by people like the late Hollis Chenery and Jan Tinbergen. On this score I can mention that I recently encountered one of my former finance students, and when he informed me that he had left finance and was interested in development economics, I congratulated him, and suggested that he should become profoundly acquainted with the work of Hollis Chenery. 3. 1974-1999: RELATIVELY QUIET DAYS ON THE WORLD OIL MARKETS 'Relatively quiet' means quiet relative to the present somewhat confused situation, where hopefully the global macroeconomy is in the early stages of a recovery from a partial macroeconomic and financial market meltdown. The rain on this parade is the movement of the oil price to over $80/b, which I happen to consider unhealthy, given the unemployment situation in e.g. the U.S. More alarming, if another oil price escalation begins, it might begin in the $75-85/b range, while the escalation in 2007-08 that carried the price to above $147/b apparently began at about $40/b. An oil price of $147/b or above is an experience that should definitely be avoided if possible, because despite what some people might think, the global macroeconomy cannot support that price. In l981 the Iranian Revolution took place, which removed approximately 2 mb/d of oil from world markets, but this shortfall was quickly made up from oil extracted elsewhere. There was of course a short lived and not particularly intensive oil price spike, however in l982-83 another disturbing - although again largely unnoticed - event took place, in that more oil was consumed than discovered. This tendency has continued, and only incurable optimists expect it to be reversed. Another price spike took place in 1991, at the time of the first Gulf War, but once again there was plenty of oil available in the world, and as peace descended on the Middle East, the price of oil moved into a prolonged decline that lasted until the final years of the century, That was when oil touched $10/b, and The Economist predicted a possible descent to $5/b, claiming that according to the fundamentals, this was where the oil price belonged.. The possibility that the future price of oil might remain in that range quickly concentrated the minds of the OPEC directorate, and unlike many commentators on the world oil scene, they realized that the supply of (UK and Norwegian) North Sea oil was about to peak. As a result they understood that if they played their hand carefully and correctly, the time would soon arrive when some countries in that grouping would see their most incredible dreams come true. What we need to consider before moving to the great oil price upswing that began several years later is a refinement of the analysis that I developed many years ago for the copper and aluminium markets, when I was employed in Geneva (Switzerland) by UNCTAD. I would like nothing better than to claim full and total credit for this construction, which I can do for the diagram, however a large part of the basic reasoning was supplied by the brilliant econometrician Professor Franklin Fisher of Massachusetts Institute of Technology, who also made one of my academic dreams come true when he published a note of mine that was related to this topic in the prestigious journal Econometrica. To begin, it needs to be recognized that a flow model of the type above is inadequate. The trend terms in the equations suggest that we are dealing with the long term, which is well and good, but the discussions on CNN and Bloomberg emphasize the relevance of inventories for short term developments. Thus we need another model - one in which inventories are explicit. That means a stock-flow construction of the kind shown in Figure 1. Derivative markets (e.g. futures) could also be brought into the analysis in a non-superficial manner, but first readers should make some effort to absorb the following discussion, and in particular the details of Figure 1. As I tell my students, the first step in doing this is to look very carefully at this diagram, and realize that it is both simple and logical! For example, it is NOT the kind of flow diagram that we see in electrical engineering textbooks, and thus Kirchoff's laws are totally inapplicable, even if we wanted to make heavy weather of the first-order servomechanism that is associated with the p-DI component of the diagram. It is in this (feedback) circuit that the instabilities mentioned earlier originate. 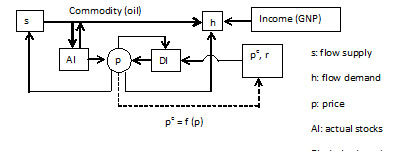
Hedge funds and futures markets influence to some extent the expected price, and consequently the magnitude of desired stocks (i.e. inventories). If for example DI > AI because it is expected that price will increase, then price will increase as an attempt is made (via an increase in flow demand) to increase stocks (i.e. AI). But at all times the key items in this short-term price formation model are stocks (i.e. inventories), which conceptually are more important than the supply (s) and demand (h) flows! The mechanics of this market (and also futures and options markets) are explained in detail in my energy economics textbooks (1970, 1977), where it is emphasized that equilibrium comes about when AI = DI, and not s = h. My students must understand this perfectly, and it - and Figure 1 - must be presented and explained on EVERY examination. Sometimes I handle this model with a differential equation, but the only thing this does is to infuriate some readers. Instead, let's keep the analysis simple. If AI >DI, then price falls in order to make the excessive inventories more attractive to consumers. The sequence is AI >DI ? p??h>s? AI??AI = DI. What about when DI>AI? Then the adjustment procedure is equally simple: DI>AI ? p??s>h? AI?? DI=AI. Pedagogically, dealing with this issue as is done here makes more sense than writing a differential equation in which the degree of the equation is arbitrary. (Readers can now explain why we do NOT have an equilibrium if we have s = h, but AI ? DI.) In conjunction with the above diagram, some simple algebra might be useful, though it should not be over emphasized. Rather than formulate and solve the differential equation that I usually use, I sometimes resort to the following simple relationships, where DI has been changed to D, and AI to A: 
Two things need to be pointed out here. The first is the logic of inventory adjustment in this scheme. If, for example we have D > A, then price (P) must be raised to an extent that we have flow output greater than flow consumption (s>h), and thus an increase in inventories. The second is the 'triviality' of this model, and for that matter those that are much complicated. A first order difference equation will be obtained from these relationships, however it would be a simple matter to obtain one of higher order. The important thing in this section is Figure 1, which all of my students in every university where I have taught, must be able to duplicate in an examination situation, and explain employing a few symbols. Obtaining the basic difference equation is simple. From the system and what I call the logic of inventory adjustment we immediately obtain: 
Notice that there is no lag in the flow supply and demand equations. The reason is that these equations are arbitrary, and are merely intended to stress that when the issue is price formation in this kind of model, inventory behaviour is crucial, and this would be true regardless of the exact configuration of the flow equations. Readers who desire something more sophisticated are referred to the first chapter of R.D.G. Allen's book 'Mathematical Economics' which is probably one of the most important economics books ever written. A little manipulation of (6) will give us the following:  Solving this is easy. If we have a price P0 when the decision is made to adjust inventories, and the equilibrium price - if there is one - is P*, then the solution is:  As it happens, if ? < (b - a)-1, then price approaches P* steadily. Otherwise there are damped or explosive oscillations, where in the last case there is no equilibrium. I see no point in continuing along this line, although one thing needs to be emphasized. An instantaneous adjustment of inventories (i.e. stocks) such as we might encounter on the pages of an Economics 101 textbook, more or less eliminates the distinction between stock and flow equilibria (where, borrowing from physics, an equilibrium means a state of rest). That observation doesn't help us very much where discussing this topic is concerned, and so we will have to touch on speculation, which will be treated somewhat more expansively in the next section. Average inventories of oil for the US, Europe and Japan from January 1991 through March 2005 came to about 775 million barrels. These were fixed inventories, and an additional 830 million barrels (called floating inventories) were in transit at sea. More commercial stocks were held in the rest of the world, but there are no figures on the exact amounts. (There might also have been a billion barrels in official inventories - e.g. the US Strategic Petroleum Reserve (SPR) probably has about 800 million.) Now suppose that for one reason or another there is an increase in DI, and this is accompanied by an intention to raise AI by some fraction of one percent (1%), and in addition to do so in a short time. In terms of the diagram above this puts a pressure on supply (s) that it cannot easily support, given the absence of reserve production capacity in the real world market. (For instance, OPEC's spare capacity is almost certainly not the 5-6 mb/d estimated by the IEA and EIA, but probably 2-3 mb/d.) As a result the price (p) will immediately increase, and perhaps by a large amount. (What we have here is the difference between short and long run supply elasticities.) Yes, the people in front of computers may have contributed to this situation by misjudging the developing situation in the oil market, and thus playing a small or large part in causing pe to become something that it should not be, but the big problem was the failure of major oil producers in OPEC and elsewhere to locate sufficient new reserves - if that was possible - and then invest in new capacity. By way of summation, the following should be pointed out. Three genuine price spikes have been mentioned: l973, l980-81, and 1991. The most interesting spike though was a partial price spike at the end of the century, when OPEC reduced its output by 1500 barrels per day. That showed the OPEC directorate what might be possible a few years later, if they stopped playing ego games and manipulated the oil supply the way they had intended all along to manipulate it when the opportunity presented itself. Moreover, I am certain that I was not the only student of the oil market to note that the oil production outside OPEC was 'decelerating', and the peaking of non-OPEC (conventional) oil might take place in the not too distant future. 4. 2000 - 2020: THEN, NOW AND LATER A considerable amount of bad economic news might be the legacy of this period. As mentioned just above, OPEC appears to have put its act together, because otherwise it would be impossible to have an oil price above $80/b, as is the case at this moment. The important thing for all readers of this contribution to notice is not the sustained oil price rise from 2003-04 to the early autumn of 2008, and in particular the acceleration of the oil price that took place in 2007-08, but the way that OPEC managed to cut its losses in 2008-09 by immediately reducing aggregate output after the oil price peaked and fell to $32/b. Virtually without fanfare, output was reduced by something between 2000 b/d and 4000 b/d. That was the end of the absurd claims that OPEC was a 'paper tiger', and the price of oil would soon collapse to a bargain basement level. Now for speculation and speculators. I have a long paper on futures markets somewhere close to this computer, but I have decided that it will stay there until later. The claim that I made earlier about speculation and the oil price is really all that is necessary to deal with the financial market foolishness that at one time was running wild in various forums and classrooms across the civilized world. Anyone incapable of understanding that the United States government could easily have suppressed any speculation in oil futures that originated in the United States, could not possibly have understood the elementary technical discussion that I had planned for this part of the present contribution. Meeting the king of Saudi Arabia with his hat in his hand, and humbly asking him to increase the production of oil, was hardly the option that President Bush would have chosen if the destructive oil price escalation of 2007-8 had its origin in speculation. When this topic came up at my Paris lecture, the explanation I could have given had I not been intent on repeating (for the third or fourth time) the materials above, is roughly as follows. The preposterous theory that speculation rather than fundamentals (supply and demand) is behind the spectacular rise in the price of oil that began in 2003-04 and continued to 2008, was launched by OPEC (just as OPEC is to thank for the present comparatively high oil price). It was launched and put into circulation by OPEC, and they repeat it every chance they get. That theory has as much veracity as the 'weapons of mass destruction' fantasy that President Bush used to instigate the war in Iraq. The ostensible guilt of e.g. Wall Street and the financial districts of London and Paris was initially an OPEC fabrication, although at the present time there is a strident 'anti financial-market' backlash in one of the forums to which I contribute. I don't admonish OPEC though, because if I were in their place, I would be doing the same thing - and so would you. (I attempt to deal with a similar oil issue in my novel 'The Two Ingrids'.) The reason that OPEC could whip up this anti capital-market hostility is because a majority of the professionals reputedly speculating on oil resemble the people in front of the screens in the film Wall Street, and they have comparable educations and prospects in a world where many employees feel that they are under increasing pressure. Unlike their critics, most of these winners really and truly understand the dynamics of oil markets, or financial markets or whatever market they are involved with, and if they don't they are encouraged by their superiors - at e.g. investment banks and other financial institutions - to find another line of work. (They also do not call themselves speculators! The few whom I encountered in Singapore and Sydney called themselves traders: they trade for their firms, and in the interests of their high incomes and enviable careers, they do everything possible to avoid making mistakes. In my course on oil and gas economics at the Asian Institute of Technology (Bangkok), I discussed several articles by a journalist in Le Monde, Jean-Michel Bezat, who had some very bad news to present his readers about the intentions of King Abdullah of Saudi Arabia where the supply of oil was concerned. Once again, probably after revealing their intentions dozens of times, beginning in l973, a Saudi king reaffirmed - though not explicitly - that his country was going to produce as little oil as possible from existing deposits, and if it happened that there were new discoveries of oil in his country, they would be left in the ground for the children (les enfants) of the Kingdom. I have pointed this out on many occasions, and given the opportunity I would point it out again, because it is a decisive signal where the future oil price is concerned. Now let's look more closely at the behaviour of speculators on the occasions of the oil price 'spikes' mentioned in the above sections. In all of those spikes some speculators made a lot of money, but the smart ones did not try to prolong their windfalls. This is because they knew that there was still a great deal of easily obtainable oil in the crust of the earth, and in addition oil producers possessed considerable spare capacity. It has also been claimed - though not by reliable sources - that there was considerable 'cheating' by OPEC producers. The price had to fall, and the ladies and gentlemen in the large finance houses understood that it had to fall, and those whose brains were in good working order took the appropriate actions. Things were different in 2008. There was still a large amount of oil in easily exploitable deposits, but given prices and price expectations its owners had no intention of producing it - nor would you if you had been in their place. In fact, as I argued in my Bangkok lectures, they might not have increased their output regardless of the oil price. (As an aside I can mention that while the oil price escalation was taking place, there were about two million barrels per day (= 2mb/d) of spare capacity globally, with the largest fraction of this in Saudi Arabia.) In these circumstances speculators, anti-speculators, neighbourhood betting syndicates, moonwalkers, day-trippers or anybody with an urge to make some quick cash went long in oil (by which I meant that they tended to purchase assets known as oil futures (or 'paper oil', which are also important for pricing physical oil.) This was the occasion when the billionaire investor T. Boone Pickens predicted that oil was on its way to $200/b, and he might have been correct if the macroeconomic/financial market meltdown had not commenced. It was also clear to some of us at a fairly early stage that a price of well over $100/b, which might jump to $200/b, could bring about a macroeconomic disaster. No wonder President Bush visited Saudi Arabia in May (2008), and requested some assistance from King Abdullah. Where else could he have gone, and what else could he have done that made genuine economic sense? That brings us to the bottom line in the fundamentals versus speculation dispute: logically, if X depends on Y, and Y depends on Z, then X also depends on Z. To the extent that the oil price is influenced by speculators, and speculators are smart enough to obtain their clues from things like, demand, expected demand, OPEC policies, etc, then what weight speculators exert on the price is mostly due to objective (or near objective) factors - i.e. fundamentals. Mostly? Well, that is a figure of speech, since there are a few speculators who play 'hunches' instead of bona fide financial wisdom, but they tend to have a minimum of 'juice' in this very complicated market, even if occasionally a few of these 'noise traders' are lucky and are able to last the course. In his testimony before a congressional committee, Michael Masters assured his interrogators that speculation was responsible for the big oil price upswing in 2008. He was partially correct, though his reasoning was very different from that in the above discussion, where my argument turns on an oil market in which demand is outrunning supply, with this situation threatening to prevail in at least the near future, and to which intelligent and unintelligent speculators reacted in the only way that made sense in the light of the objective situation. THE THING THAT MY STUDENTS ARE TOLD TO COMPREHEND IS THAT DURING THAT LONG PRICE ESCALATION, THE ACTIONS OF SPECULATORS WERE VALIDATED BY THE FORCES OF (PHYSICAL) SUPPLY AND DEMAND (by which I specifically mean fundamentals)! Without that validation, a very large number of traders in the large financial institutions in e.g. New York would have eventually gone home carrying the personal items on their desks in cardboard boxes, with the doors behind them opened and closed by 'security'. OPEC weighed in on the discussion by claiming that speculation was behind the oil price rises, although as far as I am concerned, OPEC's supply policy is without a doubt a cornerstone of today's oil market fundamentals. Even if Mr Masters and his distinguished interrogators and audience did not enjoy the slightest understanding of this rather unique situation, a majority of successful speculators/traders did, and were able to take advantage of their knowledge.. It also needs to be stressed that the decision makers at OPEC know - as I also know - that without speculation, market liquidity could plummet, which in turn could - could, not would - lead to a situation of the kind shown in a French TV film last year, in which mules (or horses) were seen pulling luxury automobiles. I am not suggesting that OPEC decision makers would be thrilled at this sort of panorama, but if the oil price exceeded $300/b - i.e. the price that oil reached in that French film - those OPEC gentlemen could still stroll the thoroughfares of Paris with spring in their hearts. And finally, it should be noted that a partial or full reduction in speculation would have drastic consequences for the hedging of (oil) price risk. If Mr Masters had been aware of this, and what it would mean for future investment and production in the oil sector, he might have tried to be less dramatic in his twisted interpretation of what he regarded as speculative excesses, and the ladies and gentlemen listening to him would have tried to be less gullible than they usually are when the topic is energy.. What about later - i.e. later than 2010? Word is going around, and it will continue to go around, that a global oil production peak is unavoidable. As far as I can tell, the most significant work on this topic is taking place at Uppsala University. (See for example Jakobsson et al). Some people think that a peak is already here, but is concealed by the macroeconomic and financial market distress. It appears though that a non-OPEC peak has already arrived, and this involves roughly 58% of the world supply of conventional oil. Accordingly, if the non-OPEC oil supply is flat, then according to the economic theory that I have taught, the OPEC cartel is now in control of the oil price. Unfortunately, the mechanics of that control cannot be discussed in this paper. 5. A SUMMARY The materials that I put on the whiteboard during my lecture at the GCEMP, (University of Paris, Dauphine) will have to be duplicated by my future students of energy economics if they prefer a passing to a failing grade. An item that will definitely have to be understood is Figure 1 - which was also on that whiteboard. Some of those materials are discussed at length in this paper, and I summarize them here. 1. The paper by Harold Hotelling (1931) and Robert Solow (1974), and my discussion of their shortcomings.At this point let's look at an extremely useful diagram, which was provided me by one of the most important oil economists, David Cohen (2009). The thing that readers should be particularly careful to note is the sustained upward movement of the oil price after 2002-2003, because between those dates and 2008 something was taking place that probably had never been seen in the oil market in modern times. Readers should also be aware that while the price of oil fell to about $32/b when the macroeconomic bad news intensified toward the end of 2008. A number of highly credible students of the oil market - whom I will not name at the present time - then came to the conclusion that the oil price was on its way to where they thought it belonged if the laws of supply and demand - the so-called fundamentals - became valid once more. This was somewhere around the ten dollars per barrel level attained shortly before the end of the last century. Fundamentals or not, OPEC quickly restored the situation in their favour. Moreover, my contention is that they will restore the situation in their favour in the future if it is necessary, because they have no great desire to watch a barrel of their precious oil being traded for the price of a barrel of coca-cola. 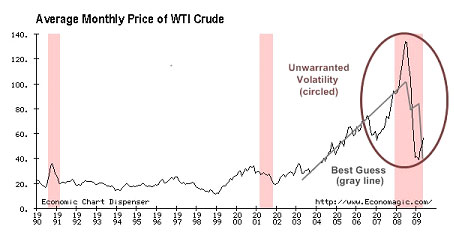
In this diagram we see a genuine oil price spike (associated with the first Gulf war), and a spike-like movement at the end of the last century, caused by OPEC cutting production by about 1,500 b/d, together with the influence on demand of cold weather in the large oil importing countries. Had the diagram been larger/wider it would have also been possible to detect the details in the conspicuous spike that took place in l973-74 as a result of the nationalization of oil by OPEC members, and also in l981, due to a change in the government of Iran. These can be compared to the sustained rise that began in 2003-04, and continued until the late autumn of 2008. One of my particularly controversial assertions is that the most important of these occurrences was the spike-like movement at the end of the last century. That demonstrated to the OPEC management what solidarity and knowledge of the oil market could accomplish in a situation where oil production was peaking in such important producing regions as the North Sea, and new large discoveries of reserves were NOT taking place. Then, in 2003-04, the escalating oil demand of China and India gave OPEC the opportunity they had always dreamed of, and they took advantage of it. They took advantage of it then, and they will take advantage of it in the future, and as a result we can only hope that our political masters will stop their dreaming where oil and energy are concerned, and adopt the policies necessary to give us the energy prices we need and deserve.. APPENDIX; SOME ASPECTS OF OIL FUTURES MARKETS With so much more that could be said about oil prices and their likely development, why turn to some mechanics of futures markets? The answer is that there are many very wrong beliefs about these markets in circulation. For instance, in the latest issue of The Middle East, (August/September 3010), the OPEC Secretary General said that " the emergence of oil as a financial asset, traded through a diversity of instruments in futures exchanges and over-the-counter markets, may have helped fuel excessive speculation to drive price movements and stir up volatility". The key word in this quote is "may", because in reality the force driving price movements during the crucial period "2003-08 was an increasing demand from Asia, together with the decision of most OPEC countries to concern themselves with their own welfare - future as well as present - instead of that of motorists in the oil importing countries. What is needed is an applicable introduction to this topic, and here I can recommend both of my textbooks, as well as my finance book (2001). The plain truth is that students and others often refuse to understand that futures and options are very simple subjects as long as the advanced mathematics are ignored. And despite what your favourite finance teacher might have told you, almost all of the advanced mathematics is completely and totally superfluous. Furthermore, Carol Loomis, in an article in Fortune called 'The risk that won't go away' (March 7, 1994) claims that few people have more than a sketchy understanding of these assets (e.g. futures) anyway, and that includes what she calls "top brass" in the financial and corporate worlds. I say thank you to that, and include in the ranks of those who lack understanding - or 'smarts' as they are sometimes called on Wall Street - most of her esteemed co-workers at Fortune, as well as many experts they cite. One of the difficulties here is that to comprehend the relation between the oil market and the financial market it is necessary to have a reasonable insight into both, and even a likely future Nobel winner in economics - Professor (of finance) Robert Schiller - is somewhat vague on the history and mechanics of the oil market, as he demonstrates in a recent article in Forbes (2007). Like options and swaps, an oil futures contract is a derivative asset, which means that its payoff is tied to the value of some other variable, in this case physical oil, which is also referred to as the underlying or actuals. (The barrels mentioned on a futures contract are often called paper oil.). Because delivery is generally an alternative (but not a necessity), a futures contract is not a fully-fledged forward contract, which is a contract obliging one party to buy and receive a specific commodity (or asset) for the price that is quoted at the maturity date, and another party to sell and deliver the asset. (Please note that a conventional forward market typically involves private buying and selling arrangements between identifiable buyers and sellers that call for the future delivery of a commodity.) In the classroom a futures contract is sometimes called a standardized forward contract, because it is traded on an exchange (i.e. an auction market) where prices are 'transparent' (i.e. visible), and where transactions are impersonal in that buyers and sellers are generally unknown to each other. The genius in futures markets is the mechanism for avoiding delivery. Futures markets operate as follows. Against a background of speculators betting on the direction and size of oil price movements by buying and selling futures contracts, an impersonal agency can be created which permits producers, consumers, inventory holders and various transactors in physical products to reduce (i.e. hedge) undesired price risk by also buying and selling these contracts. As uncomplicated as this happens to be, there are a great many misunderstandings about this process. One of these is the failure to realize that there is a social gain from futures trading that derives from the voluntary redistribution of risk between speculators and risk-averse dealers in physical products! In addition, despite what you may have heard or have decided to believe, futures trading usually (but perhaps not always) decreases the volatility and level of the oil price, because by facilitating the reduction of price risk, this trading encourages producers and others to carry larger inventories. By selling from or adding to these inventories, price swings can be dampened. The success of a futures market tends to be dependent on the satisfaction of several well defined criteria. For instance, it is essential that the commodity in question (e.g. oil) can be traded in bulk, and that it is bought and sold in circumstances that cause its price to fluctuate in a random or non-systematic manner. Without the latter provision, speculators may not be attracted to the commodity, and without fairly large-scale speculation, futures markets will not function properly. Here it should be noted that there are many maturities (i.e. time to expiry) of futures contracts in an individual market (e.g. 1 month, 2 months,…,etc maturities for oil contracts), but market liquidity usually declines rapidly for contracts with a maturity of greater than 6 months, and sometimes less. Thus it was senseless to refer to oil futures contracts with a maturity of several years, as the governor of the U.S. central bank (i.e. the Federal Reserve System) once did when asked about the future supply of oil (and thus its price). The lack of liquidity of futures with long maturities should be carefully noted by all readers. These days the modus operandi of speculators is known to almost everyone with access to a television set, however a few comments might still be useful. If a speculator believes that the price of oil is going to rise, then he might buy futures contracts - i.e. he goes long. This can be done by simply picking up a telephone and calling his broker (who in turn makes the purchase through the futures exchange). Similarly, if he believes that the price of oil is going to fall, he can call his broker and sell futures contracts (i.e. he goes short). Please observe that in both cases, at first remove, he is NOT dealing in physical oil. He does NOT have to be in possession of physical oil in order to sell paper oil! True, he may be in the habit of keeping a few barrels of oil in his bedroom for speculative purposes, but that is irrelevant to what we are talking about. There are many more transactions in paper oil than in physical oil on any given day. To understand this phenomenon the reader needs to remember that futures contracts are also forward contracts, in that delivery conditions are stipulated on them relating to the movement of a specified amount of physical oil, on or perhaps slightly after the maturity (or expiry) date of the contract, during what is called the delivery month. However in a viable futures market it is always possible to avoid making or taking delivery on a contract! For example, with a long contract, at any time before the contract matures (i.e. before the contract's expiry date), an offsetting (short) sale is made for the same amount of oil, referred to the same delivery month given on the long contract. If e.g. Mr X opened a position by going long, he can close it by simply calling his broker and going short! Obviously, market liquidity is the most important factor for this operation, as the reader knows from the ease with which shares (or stocks) can be purchased or sold, and which is due to the considerable liquidity in most share markets. The evidence indicates that delivery takes place on less than ten percent of futures contracts. This is not just because of the ease of offsetting a contract, but because delivery on futures contracts are made to or from locations that are inconvenient to most transactors. If you live in Chicago, and delivery on your long contract is made to West Texas, this takes some of the joy out of opening a position for the purpose of having immediate access to the physical commodity. In addition, as outlined in my textbook, delivery can sometimes be avoided by resorting to cash settlement. For example, a contract is held until the delivery date, at which time, or shortly after, both long and short positions are closed by 'losers' making a payment to the exchange, and 'winners' receiving a payment. The important thing here is the specification, by the exchange (or its clearing house), or 'the market' of a settlement (or 'reference') price. Before making a few comments about the hedging of price risk, there are several extremely important topics that need to be perused. These have to do with margin, 'marking to the market', and the clearing house. The clearing house is a non-profit operation belonging to an exchange. It acts as an intermediary (or 'middleman') in transactions, while at the same time making sure that monies are routed from losers to winners. For instance, if Mr X opens a long position and the price falls instead of rises, then he owes somebody money. Similarly, if Ms Y opens a position by going short and the price falls, she has made a profit. Why is this? She starts by selling a contract for F1, and the price falls to F2. Her gain is then F1 - F2 (minus the broker fee). Perhaps the main function of the clearing house is to guarantee transactions. In order to carry out this function they are involved in marking-to-the-market, which means that every night after the exchange closes, clearing house employees examine the transactions that took place during the day, and inform brokers (who are certified members of the exchange) of winners and losers among their clients. These brokers in turn adjust the accounts of their clients, and perhaps inform them. Let's take the case of Mr X. Suppose that the oil price when Mr X went to bed, and after the exchange closed, was $40/b, and he dreams that it will increase. As a result he calls his broker the next morning and instructs him to buy one contract, which always is for 1000 barrels, and therefore the cost of the contract is $40,000. But instead of paying this forty thousand he pays his broker margin, which is a security deposit, and is usually between 5 and 10 percent. Suppose that it is 10 percent, which means that he must make 4000 dollars available for his broker. Essentially someone is lending him $36,000, and we use the expression leverage to describe this state of affairs. (A futures market offers its participants considerable leverage.) Often this margin is already in Mr X's margin account, which is held by his broker. Suppose that at the time of the transaction the margin account of Mr X was $5000, of which $3500 is specified by the broker as maintenance margin, which is a kind of lower limit for Mr X's margin account. Now we can examine the situation at the end of that day. Suppose the price of oil futures increases to $41/b. Mr X's contract is marked to this amount by the clearing house, which means that his margin account (with his broker) now contains $6000. Of course, the $1000 profit realized that day - minus the broker's fee - can immediately be removed, which brings the margin account back to $5,000. (Note that just as Mr X gained $1000 because he was long in the oil market, someone else lost the same amount because they were short. One of the beauties of this arrangement is that accounts always balance! ) But suppose that during that day the price fell to $38/b instead of increasing. His contract is marked to the market at $38/b, which means that Mr X is a loser, and his broker owes the clearing house $2000 (which will be passed to a person holding a short position). This money is in Mr X's margin account and can be transferred to the clearing house, but now Mr S's margin account is $500 below maintenance margin. A margin call then goes from the broker to Mr X for $500, and if this money is not forthcoming during the day, the broker will usually close Mr X's position in that contract by immediately selling it at the prevailing price. Notice that the issue here is maintenance margin as compared to positive margin. What the broker wants to do is to make sure that if the oil price suddenly fell from $40/b to e.g. $34/b, and Mr X was in his favourite jazz club in Paris and unreachable, his firm would not have to pay for the total decline ($6000) of this particular contract. Instead they would have to account for $1000 of this decline, following which they would curse themselves for not requiring more maintenance margin. It might happen though that they had an agreement with Mr X to transfer excessive margin from other contracts the brokerage might be holding to this contract if a price decline caused margin to move below the maintenance amount (= $3500). Once we understand the above, and the convergence of 'paper' and physical (or 'actuals') prices, the explanation of risk avoidance (or price insurance) becomes a detail. Convergence comes about because in its absence there is arbitrage (which means the ability to realize a riskless profit). If the price on the physical market is greater than the price on the paper market, then holders of long contracts take delivery and immediately sell on the physical (or 'spot') market. This reduces the spot price. On the other hand, if the price on the physical (spot) market is less than the price on the futures market, then holders of short contracts buy spot and deliver oil. This raises the spot price. These operations can be refined somewhat, as explained in my textbook. Now for hedging (i.e. price insurance). Suppose that Mr X must buy some oil in 30 days, and is afraid that the price will escalate. He then buys a futures contract (i.e. goes long). If the price of physical oil goes up, and there is a convergence of the physical and paper prices, then what Mr X loses on physical oil he gains on paper oil. As the reader can easily show, he has 'locked in' the price of oil. Suppose that Ms Y is producing oil but is afraid that the price will fall. She might then sell futures contracts: if the price of physical oil fell, so would the price of paper oil, and what she lost in the physical market she would gain in the paper market. She too has locked in a price. That brings us to a short mathematical exercise touching on the famous case of MGRM, a U.S. subsidiary of one of the largest firms in Germany, Metallgesellschaft, which lost about 1.3 billion dollars in a flawed hedging project. What MGRM did was to offer U.S. firms fixed price forward contracts for (physical) oil products. These forward contracts had maturities of up to 10 years, which means that MGRM was accepting a considerable price risk, however it was the theory of their management group, which included a former professor of economics, that all would be well if a hedging program was employed that involved 'rolling over' short-term contracts. This is sometimes called a 'stack hedge', or 'stack and roll', and the magic in the scheme was supposed to be injected by what is defined as backwardation, with current futures contracts selling at a premium to far-dated futures contracts. Here I 'adjust' the important analysis of Charupat and Deaves [12]. At time t = 0, for example, a 3 month contract is purchased for a certain amount of oil or oil product, and I designate this operation ?F3(0). This contract was then sold at, for example, t = 2, at which time there is still one month to go to its maturity. I designate this selling operation +F1(2). Moreover, at this time another 3 month contract was bought, which can be designated as ?F3(2), which was sold in two months (at time t = 4) and so on. If the physical item was sold forward for C(0,T) at t=0 for delivery at time T, then total undiscounted profit V over the period T takes the following form: 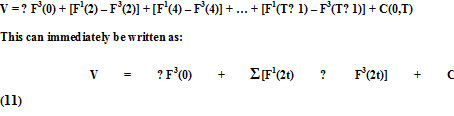
To make this work, the summation is from t = 1 to t = (T-1)/2. Charupat and Deaves have a closing out of one contract on the last day before the delivery month, and the purchase of a new one (i.e. rolling over the contract) the next day, but I prefer the above scheme. The thing to notice here is that if the majority of expressions in the brackets are positive, then the profit (V) might also be positive. For a typical parenthesis to be positive then we must have [F1 ( ) - F3( )] > 0, which means that a near-term futures contract has a higher price than a distant contract. As noted above, this is backwardation (or inversion), and MGRM's hedging team thought that this was almost always true for oil. They were essentially correct, however 'contango' (when the opposite happens) is always possible, and in the case of MGRM it happened, and kept on happening. At the present time it is often claimed that the long spell of contango that we have experienced over the past year or two is responsible for the enormous amount of oil that is not stored all over the world. Something that is often overlooked in the populist crusade against futures markets, is that that speculation offer hedgers some extremely important insurance against unpleasant price arrangements. In an efficient market speculators should expect to be rewarded for providing this service. If we consider only short hedgers (who are afraid of a price decline), then we must have E(Pt+n?Pt) > Ft+n, E is the expectation at time 't' of the price at time 't+n' of the oil to be delivered at that time. Ft+n is the relevant futures contract. A useful discussion of the oil futures markets can be found in an article by Fatouh Bassam (2006). He comes to the following conclusion. "The declining liquidity of the physical base of the reference crudes, and the narrowness of the spot market, have caused many oil exporting and oil consuming countries to prefer an alternative market to derive the price of the reference crude". This is true, although they didn't have to look any further than my earlier books, and especially my book on copper (1974), because I made it clear that based on the research I did during three years in Geneva (Switzerland) at the United Nations Commission on Trade and Development (UNCTAD), contracts for given amounts of copper, settled at the time of delivery for prices that are transparent on the copper futures markets, had much to offer - in theory at least. This was discussed extensively on a later occasion at a workshop in Paris, presided over by perhaps the most brilliant analytical development economist of the last century, the lat Professor Hollis Chenery. A problem inevitably arises though whenever there is a very great deal of money in play, in that some very intelligent people might be tempted to manipulate prices. Can they do this? Frankly I don't know, although I suspect that for a commodity like oil, where the amount traded - both physically and in money terms - is enormous, it would take a cartel of investment banks and/or hedge funds to influence the price. I happen to believe that a cartel of this sort would be difficult or impossible to form in the industrial world, and if it was possible, concealing it from law enforcement would be difficult. One more comment on this subject might be useful. In his article Professor Solow says that he wonders whether public policy can contribute to stability and efficiency where reserves, technology and demand in the fairly far future is concerned. This leads him to encourage "organized futures trading in natural resource products. To be useful, futures contracts would have to be much longer-term than is usual in the futures markets that now exist." Well readers, that's more rain on our parade, because where oil is concerned, contracts tend to be illiquid after six months and sometimes less. Of course, some people do not know this, while others do and pretend otherwise. REFERENCES Adelman, M.A. (1994). 'The world oil market: past and future'. The Energy Journal. Aleklett, Kjell and Colin Campbell (2003). 'The peak and decline of world oil and gas Production'. Minerals and Energy (18-1). Al-Ali, Zaid (2010). Iraq's dangerous and depressing reality. (www.OilPrice.Com), 28 August. Bacevich, Andrew J. (2010) 'Remember Iraq'. The Spectator (21 August) Banks, Ferdinand E. (2011). Energy and Economic theory. London, New York and Singapore: World Scientific. (Forthcoming). ______. (2010). The Two Ingrids (A novel about oil and war). (In process). ______. (2008). The sum of many hopes and fears about the oil resources of the Middle East. Lecture given at the Ecole Normale Superieure (Paris), and The Asian Institute of Technology (Bangkok, Thailand), ______. (2007). The Political Economy of World Energy: An Introductory Textbook. London, New York and Singapore: World Scientific. ______. (2005). 'Logic and the Oil Future'. Energy Sources. ______. (2004). 'A new world oil market'. Geopolitics of Energy (December). ______. (2001). 'Global Finance and Financial Markets'. Singapore: World Scientific. ______. (2000). Energy Economics: A Modern Introduction. Dordrecht and Boston: Kluwer. ______. (1991). 'Paper oil, real oil, and the price of oil'. Energy Policy (July/August). ______. (1980). The Political Economy of Oil. Lexington and Toronto: D.C. Heath (1980). ______. (1974). The World Copper Market. Cambridge Massachusetts: Ballinger Publishing Company. ______. (1972). 'An econometric model of the world tin economy: a note'. Econometrica, _____ . (1971). 'An econometric note on the demand for refined zinc'. Zeitschrift für Nationalökonomie (31:443-452). Bassam, Fatouh (2006). 'The origin and evolution of the current oil pricing system' in Oil in the 21st Century (Edited by Robert Mabro). Oxford: Oxford University Press. Carr, Donald E. (1976). Energy and the Earth Machine. London: ABACUS. Charupat, N. and Richard Deaves (2003). 'Backwardation in energy futures markets: Metalgesellschaft revisited'. Energy Studies Review. Cohen, Dave (2007a). 'Living on the Edge'. ASPO (September). _____ . (2007b). 'A Non-OPEC progress report'. ASPO (September 12). Crandall, Maureen (2005). 'Realism on Caspian Energy'. IAEE Newsletter (Spring). Greenspan, Alan (2007). The Age of Turbulence. London: Penguin Books. Guler, Claudio (2010). 'Has the Iraq 'Surge' been a success? OilPrice.Com. (20 Sept.) Hatfield, Craig Bond (1997). 'Oil back on the global agenda'. Nature (May). Holtz-Giménez, Eric (2007). 'Les cinq myths de la transition vers les agr Le Monde diplomatique (Juin). Hotelling, Harold (1931). 'The economics of exhaustible resources'. Journal of Political Economy (April). Huntington, Hillard (2007). 'Oil shocks and real U.S. Income'. The Energy Journal. Höök, Mikael (2010). Coal and Oil: The dark monarchs of Global Energy. Uppsala (Sweden) Universitetstryckeriet. Jakobsson. Kristofer, Bengt Söderbergh, Mikael Höök and Kjell Aleklett (2009), 'How Reasonable are oil production scenarios from public agencies?' Energy Policy (July - on line). Lindahl, Björn (2006). 'Oljeslukande Irland väljer Sverige som sin förebild'. Svenska Dagbladet (Monday, 10 April). Rist, Curtis (1999), 'When will we run out of oil'. Discover (June). Reynolds, Douglas (2005). 'The economics of oil definitions'. OPEC Review (March). Robelius, Fredrik (2007). Giant Oil Fields - The Highway to Oil. Uppsala (Sweden) Universitetstryckeriet. Salameh, Mamdouh G. (2010) 'Some thoughts on Iraq's oil potential'. (Stencil ). ______ . (2004). Over a Barrel. Beirut: Joseph D. Raidy Sarkis, N. (2003). 'Les prévisions et les fictions'. Medenergie (No. 5). Shiller, Robert J. (2007). 'A shield against the next oil shock'. Forbes (January 22). Smith, Pamela Ann (2010). 'Will oil break the $150/b barrier?' The Middle East Solow, Robert M. (1974). 'The economics of resources or the resources of economics'. American Economic Review. Söderbergh, Bengt (2010). 'Production from Giant Gas Fields in Norway and Russia, and Subsequent Implications for European Energy Security. Uppsala (Sweden) Universitetstryckeriet. Click here to read this article as a PDF.
Professor Ferdinand E. Banks November 3rd, 2010 ferdinand.banks@telia.com
|
| Home :: Archives :: Contact |
THURSDAY EDITION March 26th, 2026 © 2026 321energy.com |
|