|
THURSDAY EDITION April 2nd, 2026 |
|
Home :: Archives :: Contact |
|
|
Oil-Price ready for BlowoutBy Makrocheck   “Tom Swift and his Great Oil Gusher” by Victor Appleton
(Grosset & Dunlap: 1924) “By some odd twist, oil gushers have come down in American cultural memory as a form of good news — evidence of riches found, like the popping of some geological champagne cork. (…) The truth, however, is that gushers, which plagued the early decades of the oil business, were disasters anywhere and everywhere they happened. They occurred when oil drillers penetrated a formation where oil and natural gas were under high pressure. The geyser of erupting oil could destroy drilling equipment, kill workers and shatter the eardrums of those it did not kill. Fire was a huge risk. Getting gushers under control sometimes took months.” (Justin Gillis; The New York Times; 21.06.2010) Back in the days, after a well was drilled, an explosive charge was released down the pipe & set off with the anticipation & hope to crack the rock open in order to increase the petroleum flow into the bore hole. These days, acids are mostly used to achieve larger flow rates. Drillers did not have & use blowout-preventers as they do today to control high-pressure reservoirs. Generally, as soon as highly pressured formations are breached, the hydrocarbon fluids (oil & gas) ascend up the well. Once reaching the surface, the hydrocarbons (now in liquid & gas state) hopefully shoot up many hundreds of feet into the air being a classical sign of a successfully discovered & spudded reservoir. However, as soon as the first hydrocarbons break through the surface & a first small blowout of oil & water is noticed, the shooting typically diminishes strongly & fades away for some seconds before the real blowout erupts highly into the air. 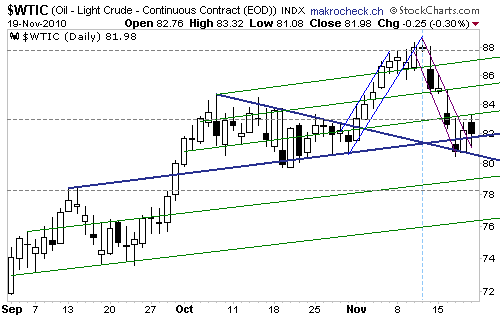 The oil-price gusher started to erupt in early November 2010 as the price broke the (blue) triangle-leg at 82. A short breakout to 88 followed, whereafter a classical pullback to the (protracted) triangle occurred. As per definition, the thrust starts directly thereafter – as the price commenced to rise the last 2 days, a thrust to the upside is anticipated (instead of a thrust to the downside). The goal of this thrust is to rise above the resistance that was marked by the previous breakout (88) & to transform it into a new & sustainable support so that a new & sustainable upward-trend can start. The oil-price gusher started to erupt in early November 2010 as the price broke the (blue) triangle-leg at 82. A short breakout to 88 followed, whereafter a classical pullback to the (protracted) triangle occurred. As per definition, the thrust starts directly thereafter – as the price commenced to rise the last 2 days, a thrust to the upside is anticipated (instead of a thrust to the downside). The goal of this thrust is to rise above the resistance that was marked by the previous breakout (88) & to transform it into a new & sustainable support so that a new & sustainable upward-trend can start. 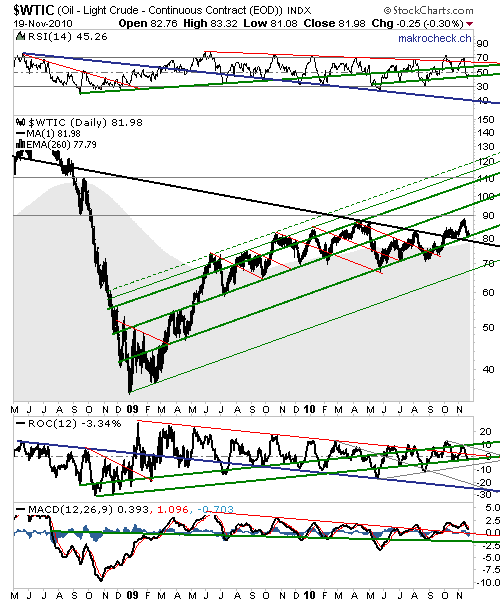 The longer-term perspective since mid 2008 shows that the price started a new upward-trend in early 2009 ascending within the (green) trend-channel. In September 2010, the (black) resistance was broken, whereafter a transformation of the (black) trendline into a new support took place. Subsequently, a first breakout occurred that just corrected to the (green) support slightly above the 80-level thus generating a new buy-signal. The next sell-signal is issued when breaching the (black) support currently at approx. 78 with the (grey) 260-EMA-curve (histogram) getting breached simultaneously generating a longer-term sell-signal. The longer-term perspective since mid 2008 shows that the price started a new upward-trend in early 2009 ascending within the (green) trend-channel. In September 2010, the (black) resistance was broken, whereafter a transformation of the (black) trendline into a new support took place. Subsequently, a first breakout occurred that just corrected to the (green) support slightly above the 80-level thus generating a new buy-signal. The next sell-signal is issued when breaching the (black) support currently at approx. 78 with the (grey) 260-EMA-curve (histogram) getting breached simultaneously generating a longer-term sell-signal.Indicators:
RSI: buy-signal since arriving & holding at the (green) support (sell-signal when breaching it).
ROC: buy-signal since arriving & holding at the (green) support. Sell-signal when breaching it – yet a next buy-signal is then positioned at the (grey) support directly beneath it so that a more distinct sell-signal is generated when breaching that.
MACD: sell-signal since both curves started to decrease recently. Buy-signal when both curves are noted to initiate a rise – potentially after a further short decrease to the (red) support.
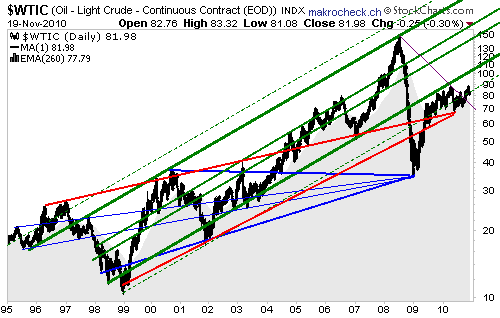 The longer-term picture since 1995 shows the price moving up predominately within the (green) trend-channel, whereas the price action can be understood with the 2 (red & blue) triangles. In 2004, the upper (blue) triangle-leg at approx. 38 was broken, whereafter a breakout to approx. 150 took place until 2008 which was followed by a pullback to the (blue) triangle-apex at approx. 35. Hence, the thrust to the upside began in early 2009. According to the upward-sloping (red) triangle, the breakout started in 2005, whereas the pullback in 2008 was not able to hold above the (red) triangle-legs starting a breakout to the downside. As the price did not continue to decrease sustainably, no thrust to the downside occurred as a relatively fast rebound above the (red) triangle was accomplished in 2009. In early 2010, a final pullback to the (red) triangle-apex at approx. 66 took place, whereafter the price started to rise indicating a thrust to the upside since then & especially since breaking above the (violet) resistance at approx. 78. As per the (red) triangle, a longer-term sell-signal is generated only when breaching the price-level of the (red) triangle-apex at approx. 66. The longer-term picture since 1995 shows the price moving up predominately within the (green) trend-channel, whereas the price action can be understood with the 2 (red & blue) triangles. In 2004, the upper (blue) triangle-leg at approx. 38 was broken, whereafter a breakout to approx. 150 took place until 2008 which was followed by a pullback to the (blue) triangle-apex at approx. 35. Hence, the thrust to the upside began in early 2009. According to the upward-sloping (red) triangle, the breakout started in 2005, whereas the pullback in 2008 was not able to hold above the (red) triangle-legs starting a breakout to the downside. As the price did not continue to decrease sustainably, no thrust to the downside occurred as a relatively fast rebound above the (red) triangle was accomplished in 2009. In early 2010, a final pullback to the (red) triangle-apex at approx. 66 took place, whereafter the price started to rise indicating a thrust to the upside since then & especially since breaking above the (violet) resistance at approx. 78. As per the (red) triangle, a longer-term sell-signal is generated only when breaching the price-level of the (red) triangle-apex at approx. 66.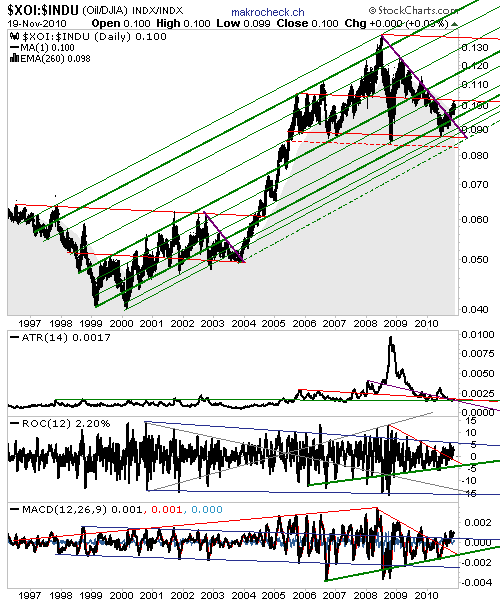 The AMEX Oil Index (ticker symbol: XOI) represents a (price-weighted) oil stock index comprising of currently 13 leading petroleum companies (composition: see below). The AMEX Oil Index (ticker symbol: XOI) represents a (price-weighted) oil stock index comprising of currently 13 leading petroleum companies (composition: see below). When comparing it with the DOW index (in form of the shown ratio), it strikes that - with its high in 2008 - the XOI has outperformed the DOW more than 3-fold since 2000. However, the ratio decreased heavily since its high in 2008 signifying that the DOW performed much better than the XOI during that time. More importantly for the present & future is that the (violet) resistance was broken successfully recently generating a buy-signal (for the XOI against the DOW). Since reaching the (red) resistance at approx. 0.10 most recently, a sell-signal was issued as a pullback became more probable potentially taking the ratio back to the (violet) support. A longer-term buy-signal (à la thrust to the upside) is not generated until rising above this (red) resistance. The components of the XOI Index (as per 19.11.2010):
 Some of these stocks are analyzed permanently at the following site:
http://en.makrocheck.ch/216-Oel-amp-Gas Some of these stocks are analyzed permanently at the following site:
http://en.makrocheck.ch/216-Oel-amp-GasBy Makrocheck |
| Home :: Archives :: Contact |
THURSDAY EDITION April 2nd, 2026 © 2026 321energy.com |
|